Fig. 8
Download original image
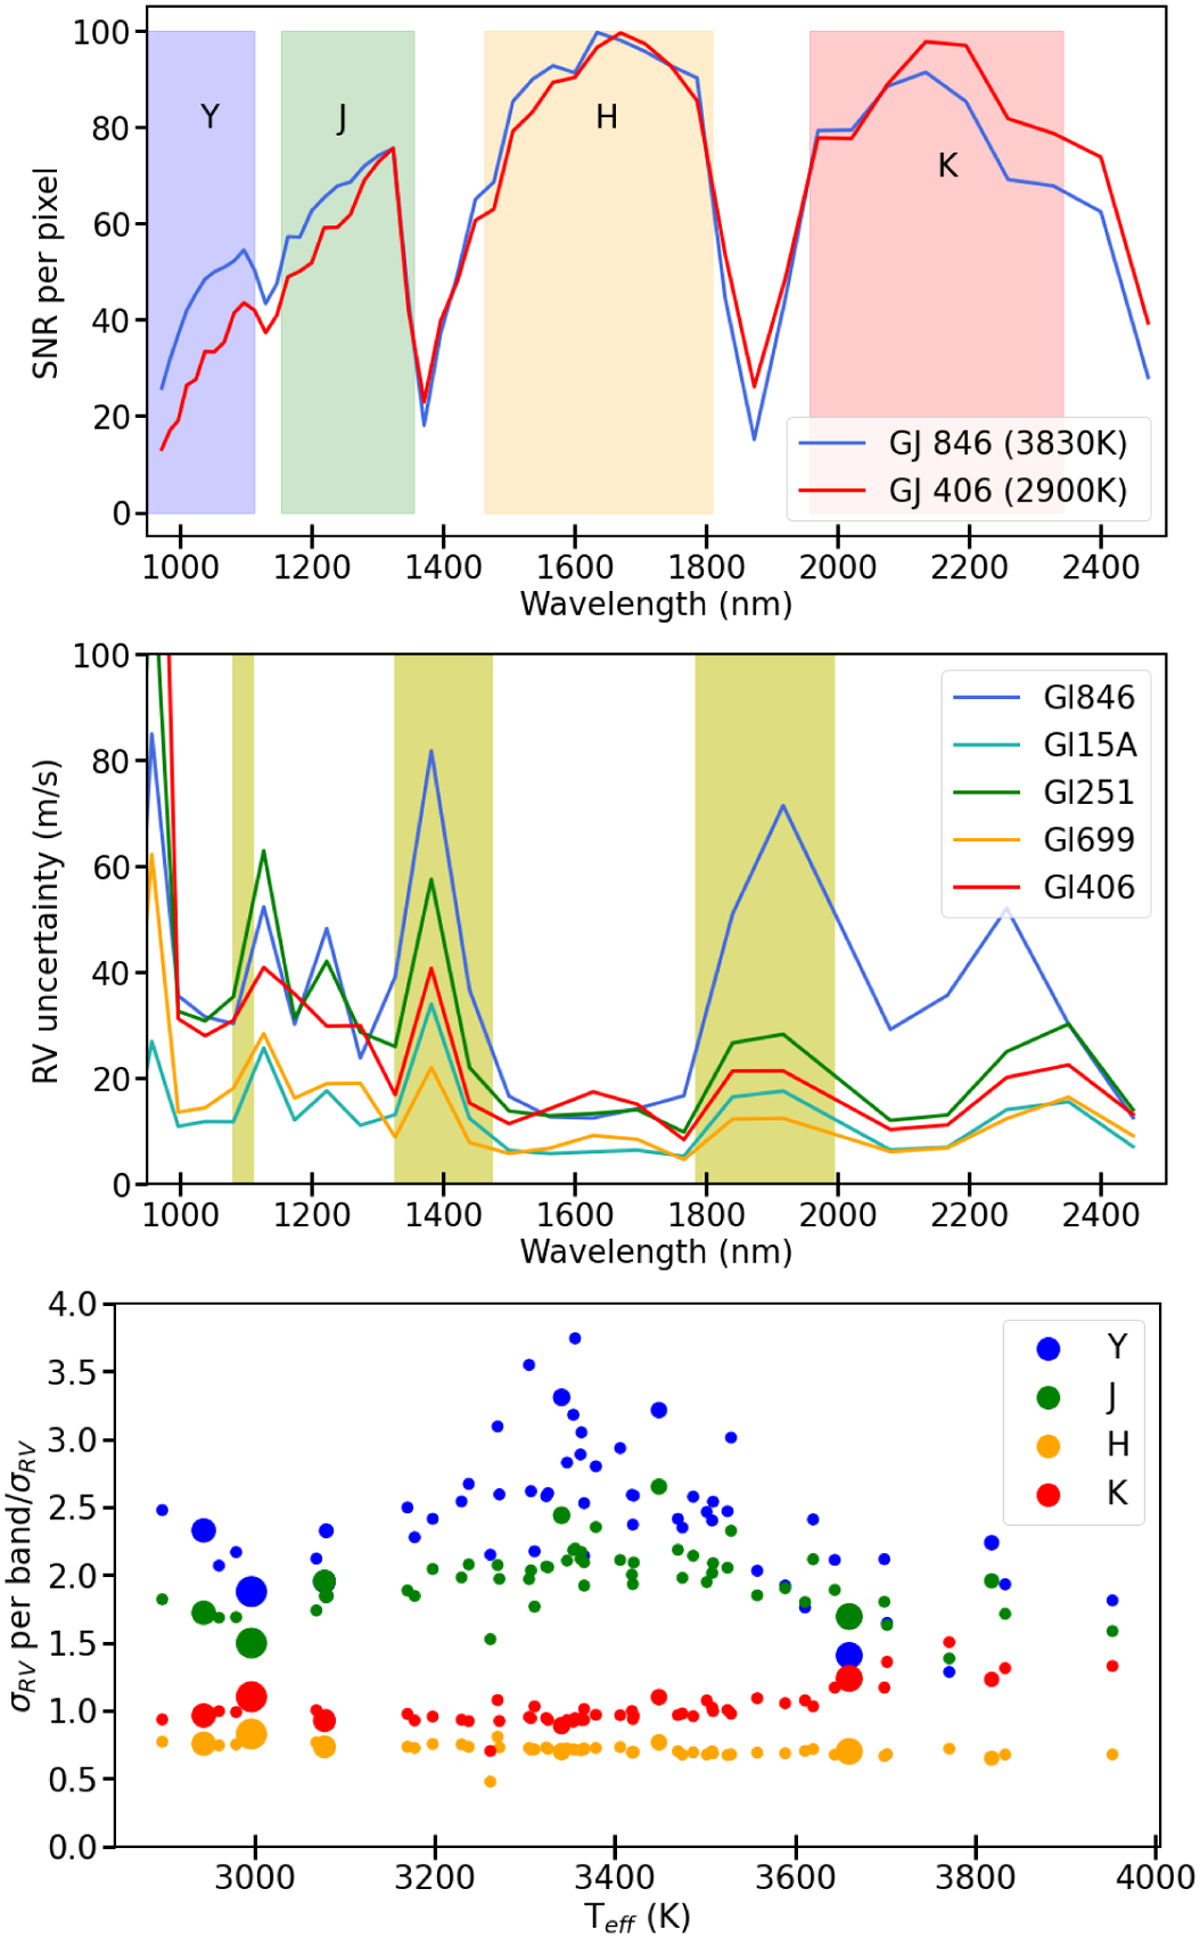
Chromatic behavior of the SPIRou data. Top: relative S/N as a function of wavelength for the hottest and coolest stars in the sample. The S/N values have been normalized at 1650 nm. Middle: RV uncertainty for a selection of program stars with decreasing effective temperatures from top to bottom in the legend plotted along the spectrum. The yellow areas show the bands with maximum telluric absorption. The RV uncertainty has been normalized to an S/N of 150 at 1650 nm. Bottom: ratio of the median RV error in a single band and the median RV error in the whole spectrum as a function of effective temperature for the whole data set. Larger symbols represent the few stars with a resolved projected rotational velocity.
Current usage metrics show cumulative count of Article Views (full-text article views including HTML views, PDF and ePub downloads, according to the available data) and Abstracts Views on Vision4Press platform.
Data correspond to usage on the plateform after 2015. The current usage metrics is available 48-96 hours after online publication and is updated daily on week days.
Initial download of the metrics may take a while.