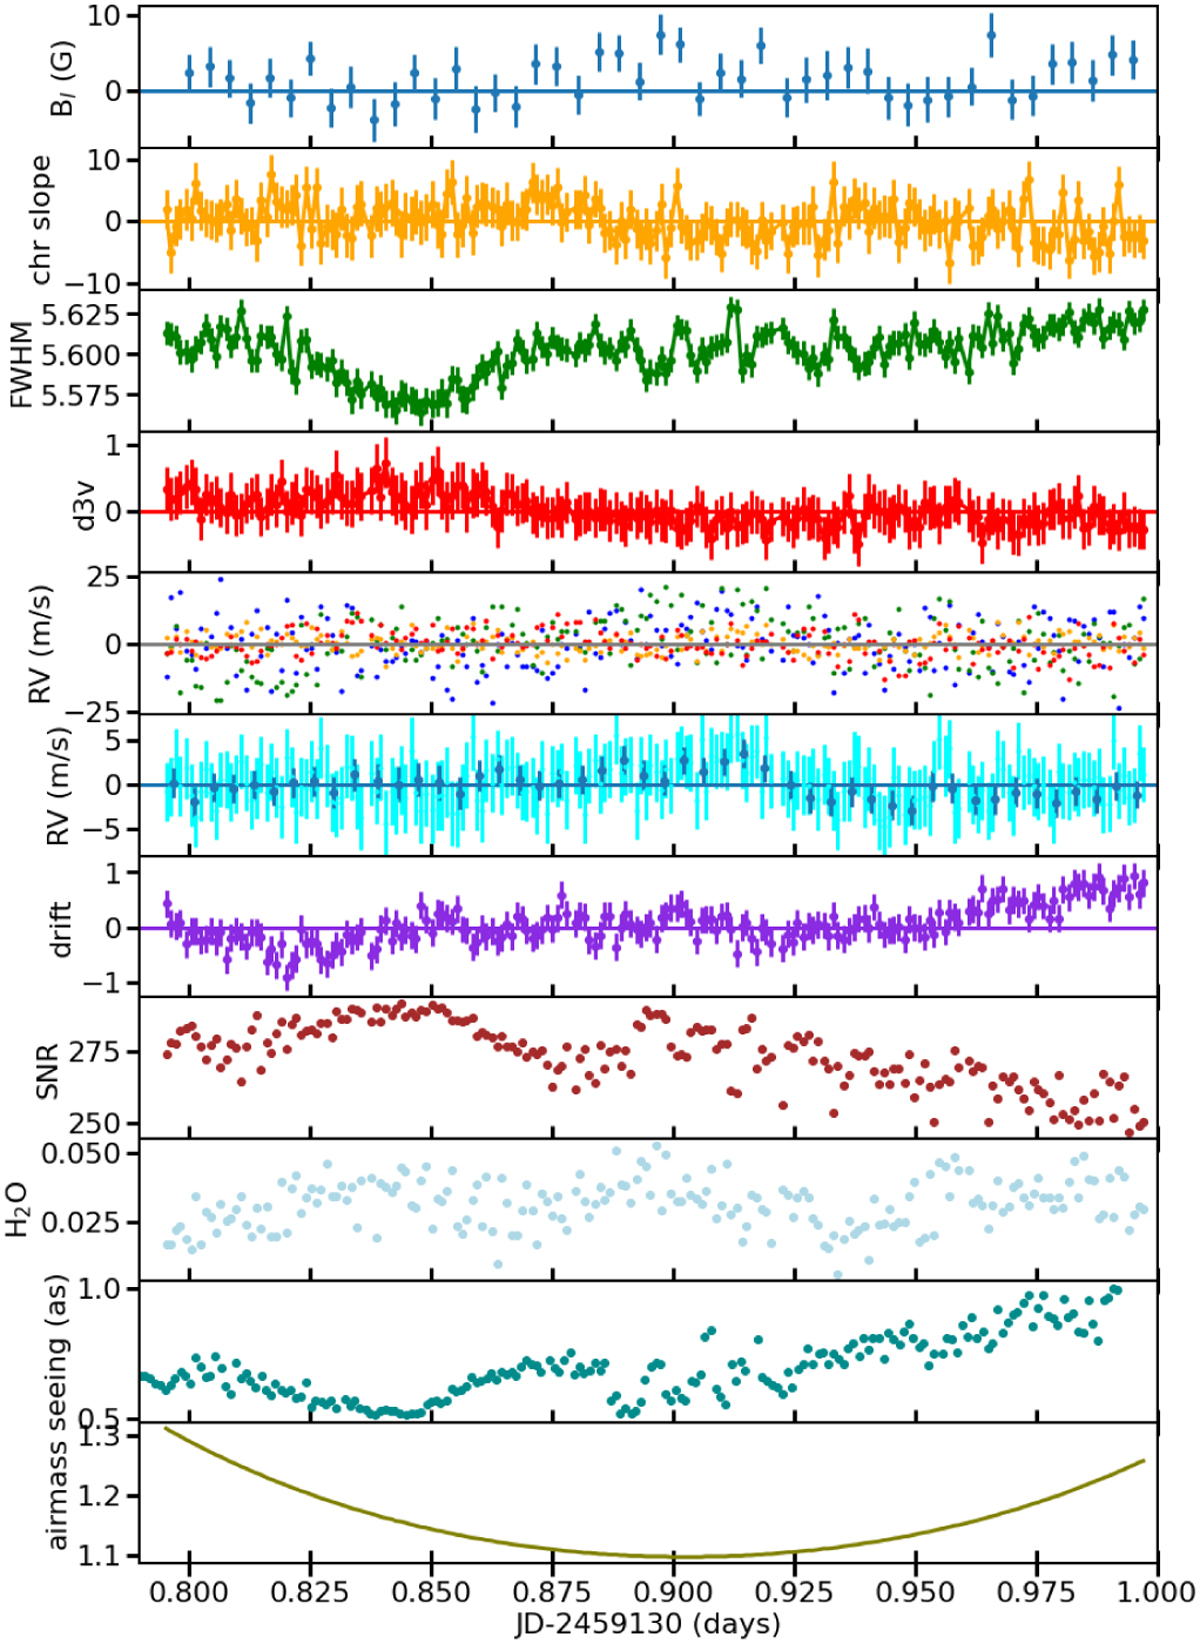
Fig. 9
Download original image
Evolution of the measured parameters during the 5 h sequence on GJ 15A. From bottom to top: airmass, image quality, amount of atmospheric water, S/N in the H band, RV FP drift, RVs (cyan for individual spectra, blue for polarimetric sequences), RVs per band (blue, green, orange, and red for Y, J, H, and K bands, respectively), d3υ, FWHM, chromatic slope, and longitudinal magnetic field.
Current usage metrics show cumulative count of Article Views (full-text article views including HTML views, PDF and ePub downloads, according to the available data) and Abstracts Views on Vision4Press platform.
Data correspond to usage on the plateform after 2015. The current usage metrics is available 48-96 hours after online publication and is updated daily on week days.
Initial download of the metrics may take a while.