Fig. 2
Download original image
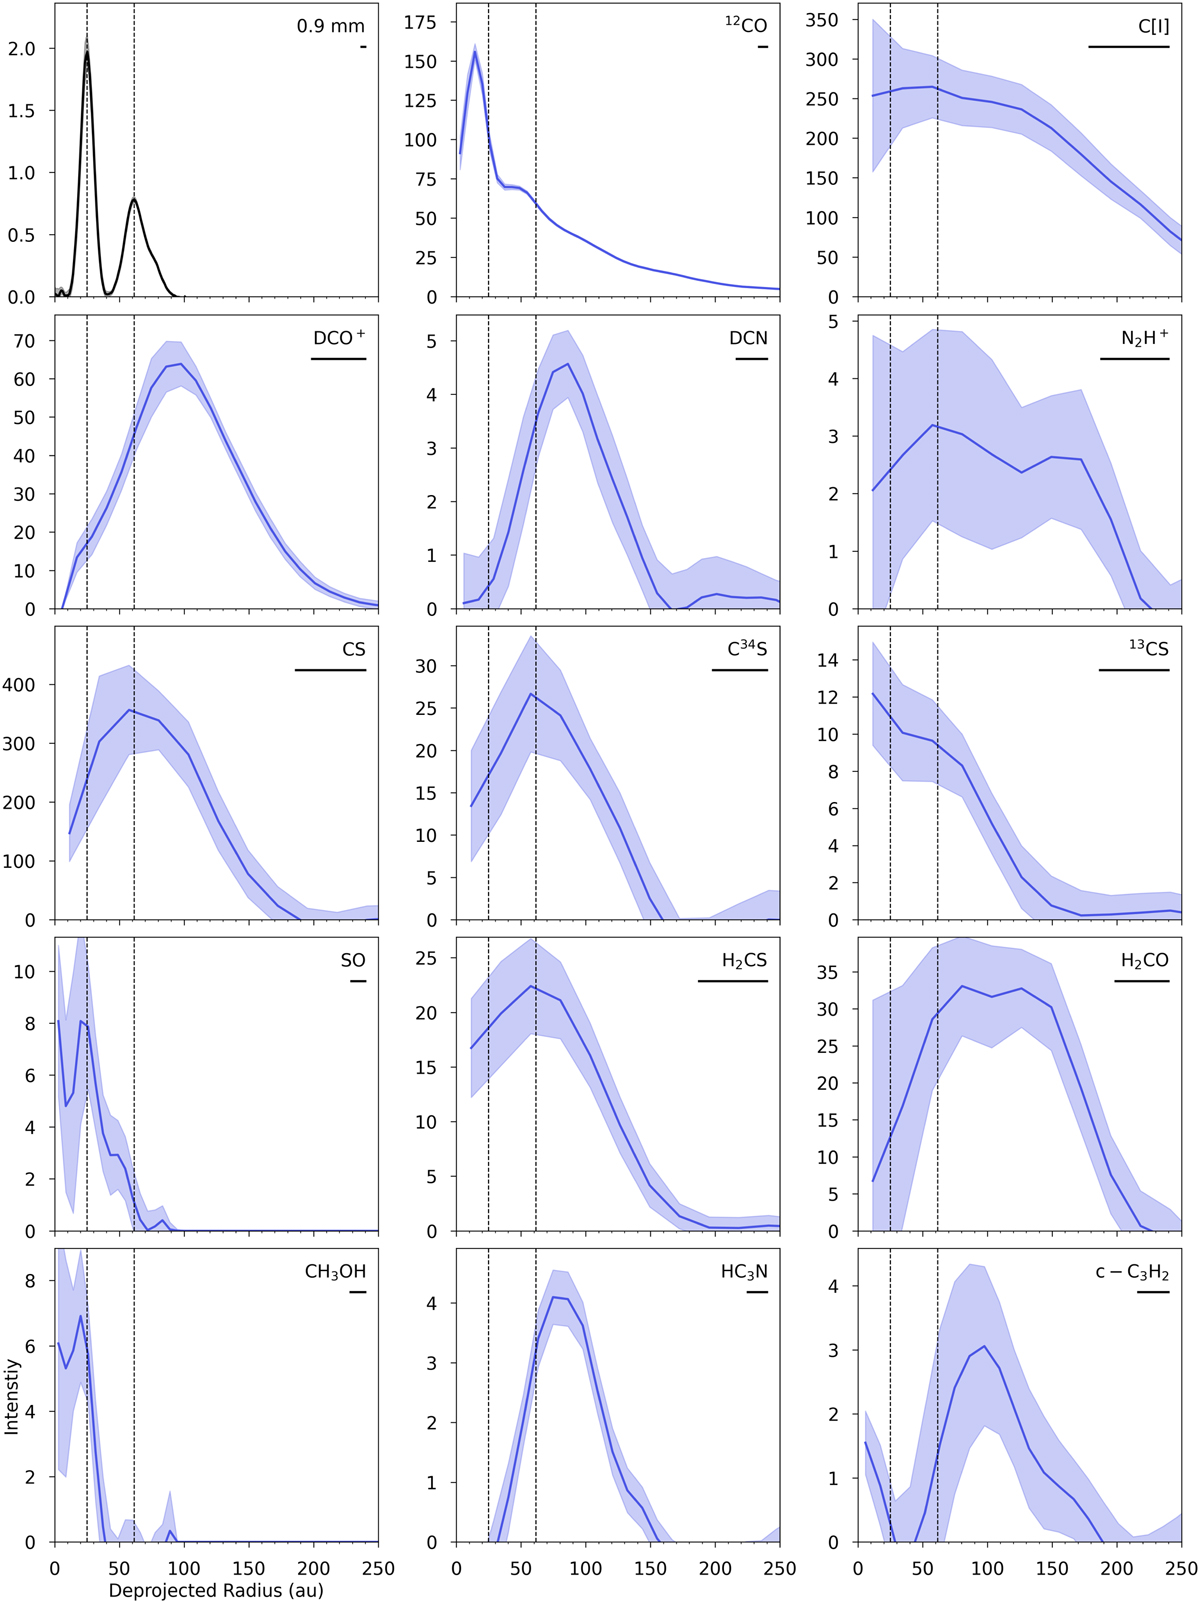
Azimuthally averaged radial intensity profiles for the 0.9mm continuum emission and molecular lines from the HD 169142 disk. The specific transitions are the same as in Fig. 1. Vertical lines indicate the peak locations of the two bright continuum rings. The bar in the top right corner of the images is the 0.5× the major axis of the beam as listed in Table 1. Units of the y-axis are mJy beam−1 for the continuum, Jy beam−1 km s−1 for the 12CO, and mJy beam−1 km s−1 for the rest of the lines.
Current usage metrics show cumulative count of Article Views (full-text article views including HTML views, PDF and ePub downloads, according to the available data) and Abstracts Views on Vision4Press platform.
Data correspond to usage on the plateform after 2015. The current usage metrics is available 48-96 hours after online publication and is updated daily on week days.
Initial download of the metrics may take a while.