Fig. 3
Download original image
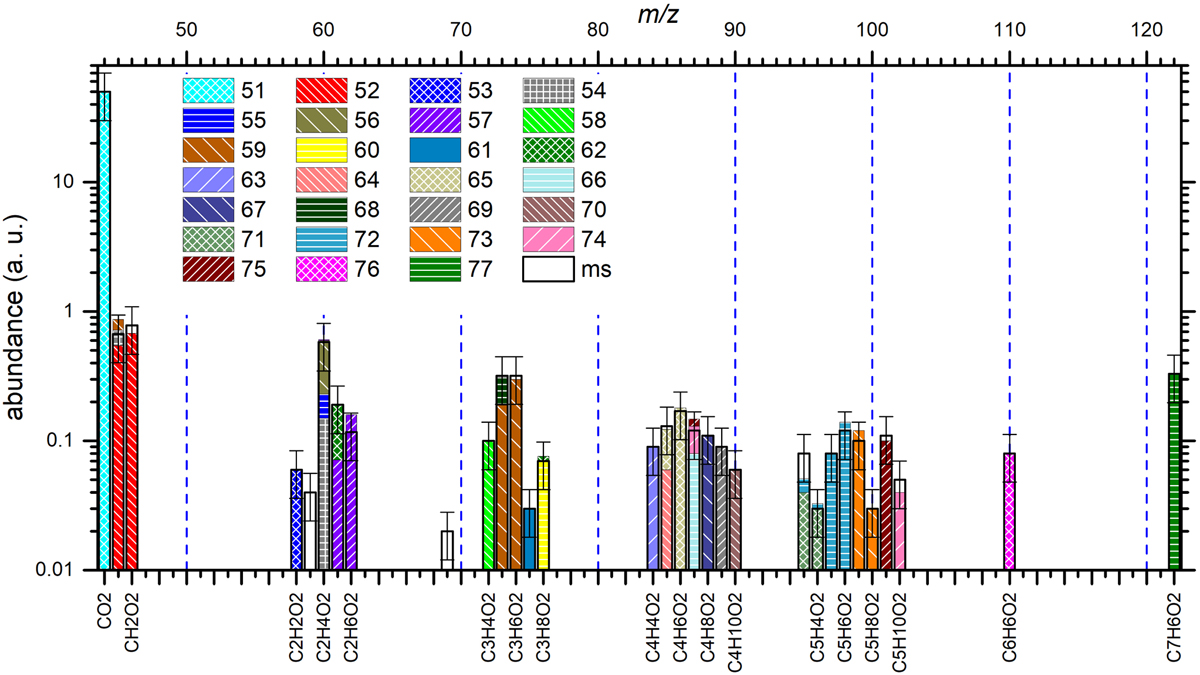
Occam’s razor-based deconvolution of the subset of signals associated with the CnHmO2 species as registered by the DFMS on 3 August 2015. The measured signals (ms) are given in arbitrary units (a. u.) with 50% error margins. With the color coding, we show the different contributions of the individual molecules to the observed sum fragmentation pattern of the CnHmO2 species (see details in the main text). The following 27 molecules have been selected: (51) carbon dioxide, (52) formic acid, (53) glyoxal, (54) acetic acid, (55) glycolaldehyde, (56) methyl formate, (57) ethylene glycol, (58) 2-propenoic acid, (59) propanoic acid, (60) 2-methoxyethanol, (61) methylal (62) 1,2-propanediol, (63) 2(3H)-furanone, (64) cyclopropanecarboxylic acid, (65) γ-butyroīactone, (66) 1,3-dioxane, (67) 1,4-dioxane, (68) butanoic acid, (69) 1-ethoxy-1-methoxyethane, (70) diethyl peroxide, (71) 3-furaldehyde, (72) 2-furanmethanol, (73) cyclopropanecarboxylic acid methyl ester, (74) propanoic acid ethyl ester, (75) 4-methyl-1,3-dioxane, (76) hydroquinone, and (77) benzoic acid.
Current usage metrics show cumulative count of Article Views (full-text article views including HTML views, PDF and ePub downloads, according to the available data) and Abstracts Views on Vision4Press platform.
Data correspond to usage on the plateform after 2015. The current usage metrics is available 48-96 hours after online publication and is updated daily on week days.
Initial download of the metrics may take a while.