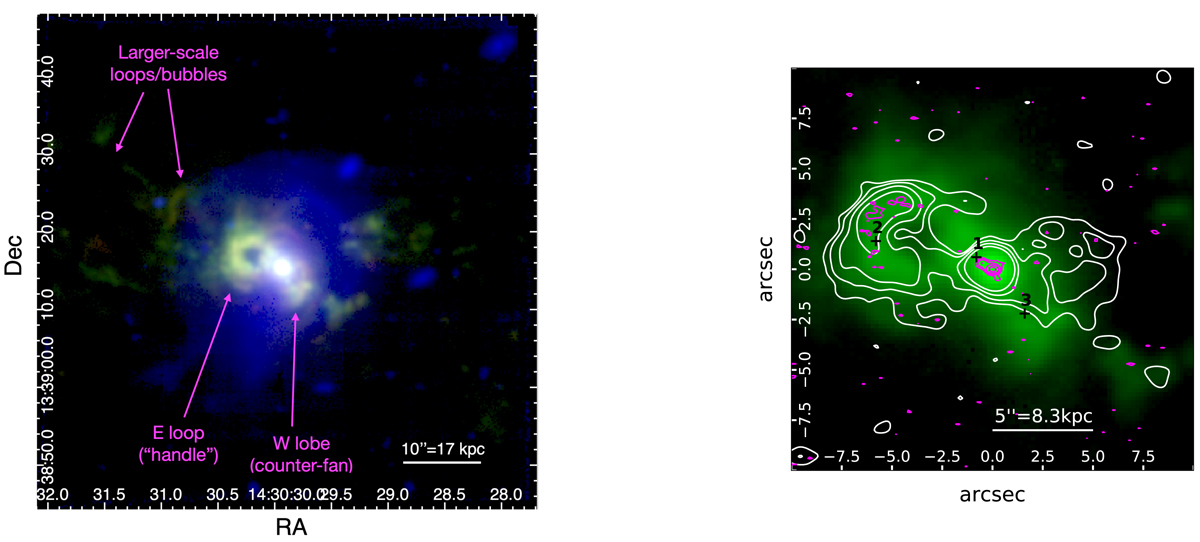
Fig. 1.
Download original image
Optical (emission lines and continuum) versus radio emission of the Teacup galaxy. Left panel: false-colour image from VLT/MUSE. [O III] ionised gas emission is reported in green, Hα in red, and line-free continuum emission averaged between 5500–6700 Å (observed wavelengths) in blue. The colour intensity scale is the same for [O III] and Hα. The main spatial features mentioned in the text are labelled. Right panel: 20″ × 20″ zoomed-in [O III] emission (same as in left panel), with the contours of the VLA 5.12 GHz (white) and highest-resolution 6.22 GHz (magenta) radio images from Harrison et al. (2015) overlaid. For the former, contour levels are 35.0, 66.0, 124, and 234 μJy beam−1; for the latter, they are 40, 102, 261, and 668 μJy beam−1. The black numbered “+” symbols mark the regions from which the spectra reported in Fig. 2 were extracted.
Current usage metrics show cumulative count of Article Views (full-text article views including HTML views, PDF and ePub downloads, according to the available data) and Abstracts Views on Vision4Press platform.
Data correspond to usage on the plateform after 2015. The current usage metrics is available 48-96 hours after online publication and is updated daily on week days.
Initial download of the metrics may take a while.