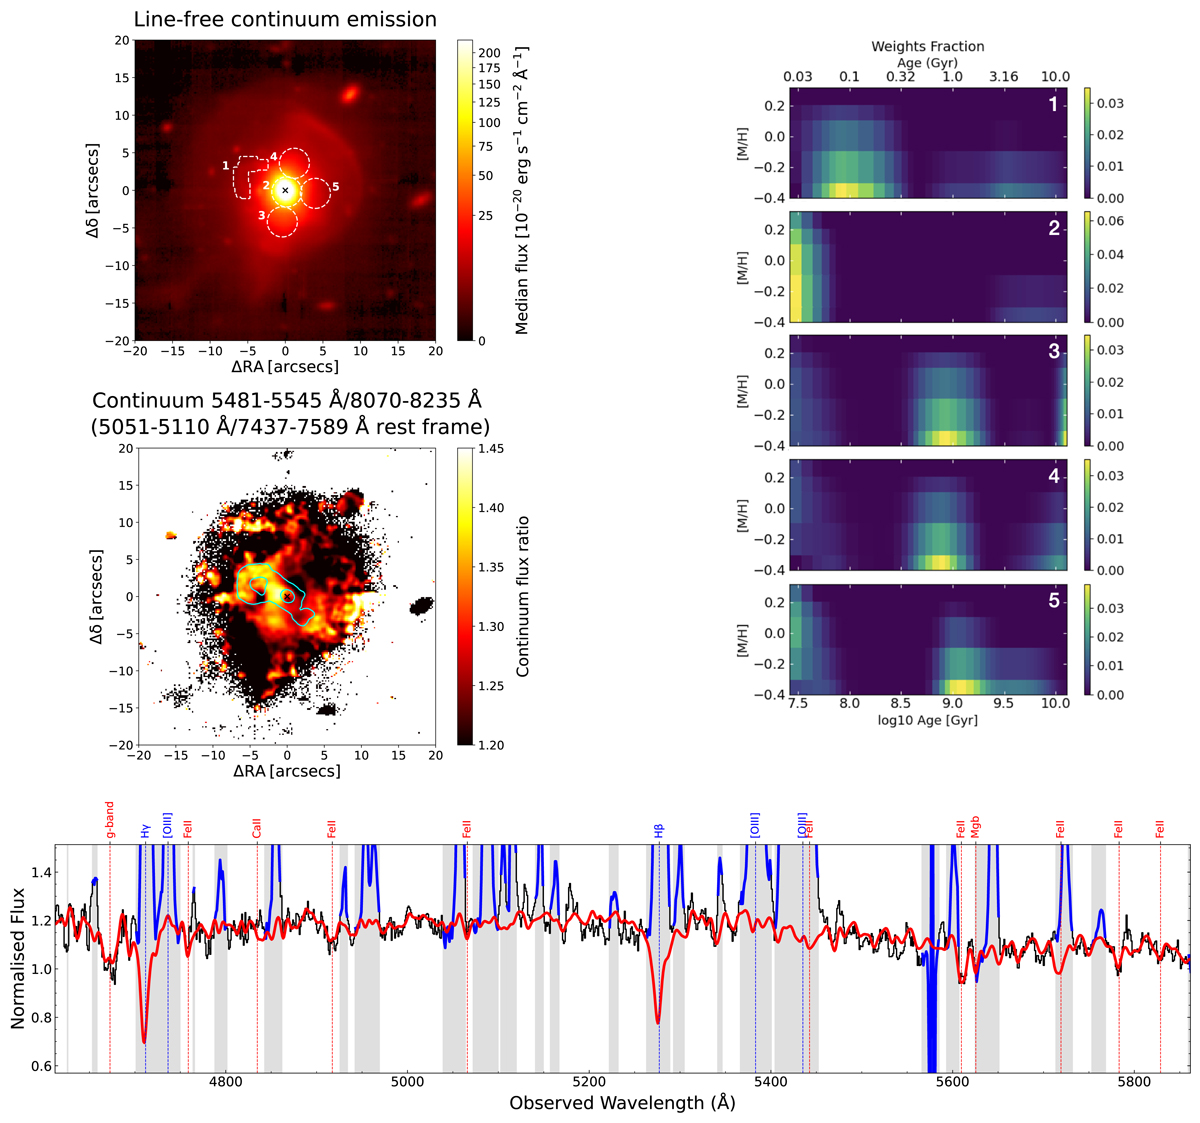
Fig. 11.
Download original image
Properties of the stellar populations, showing evidence for young stars in the Teacup handle. Top-left: zoomed-in map of the stellar continuum obtained by performing the median in all the six spectral ranges reported in Fig. 10 together (light grey shaded areas). Mid-left: map of continuum flux ratio (i.e. colour) between the images corresponding to the bluest and the reddest spectral ranges reported in Fig. 10 (top-left and bottom-right panels, respectively). Prior to performing the ratio, the continuum images were smoothed with a Gaussian kernel having σ = 1.5 spaxels, for a better visual output. The patch having low continuum flux ratio in the southern part of the handle is due to a background red galaxy. Top-right: luminosity-weighted fractions of stellar populations in the stellar metallicity (in log scale, with respect to solar metallicity) versus age plane resulting from the stellar population modelling (details in text) of each numbered aperture shown in top-left panel. Bottom: spectrum (black) extracted from the aperture covering the handle (number 1 in top-left panel) with the modelled stellar continuum overlaid (red); shaded grey vertical bands indicate spectral ranges which were masked in the fitting, and the spectrum within these ranges is marked in blue.
Current usage metrics show cumulative count of Article Views (full-text article views including HTML views, PDF and ePub downloads, according to the available data) and Abstracts Views on Vision4Press platform.
Data correspond to usage on the plateform after 2015. The current usage metrics is available 48-96 hours after online publication and is updated daily on week days.
Initial download of the metrics may take a while.