Fig. B.2.
Download original image
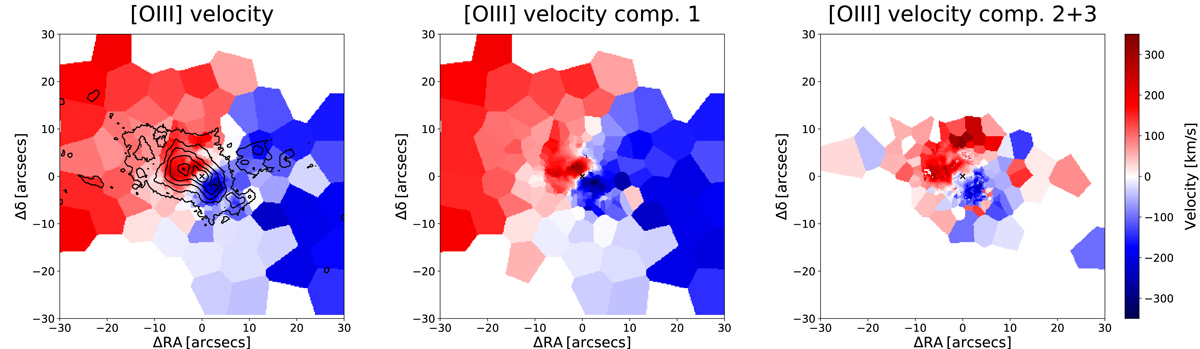
Ionised gas velocity maps of the Teacup from the fit of the stellar continuum-subtracted, Voronoi-binned data cube (see Sect. 2.2). [O III] velocity, obtained as the first-order moment of velocity of the total modelled line profile (left panel), as well as velocity of the first (middle panel) and second plus third Gaussian components (first-order moment of velocity of their summed profile; right panel) employed for the line profile modelling. In the left panel we report the contours of [O III] flux (from Fig. 3, top-left panel) to allow for an easier visual comparison between the Voronoi-binned velocity field and the morphology of the ionised gas emission.
Current usage metrics show cumulative count of Article Views (full-text article views including HTML views, PDF and ePub downloads, according to the available data) and Abstracts Views on Vision4Press platform.
Data correspond to usage on the plateform after 2015. The current usage metrics is available 48-96 hours after online publication and is updated daily on week days.
Initial download of the metrics may take a while.