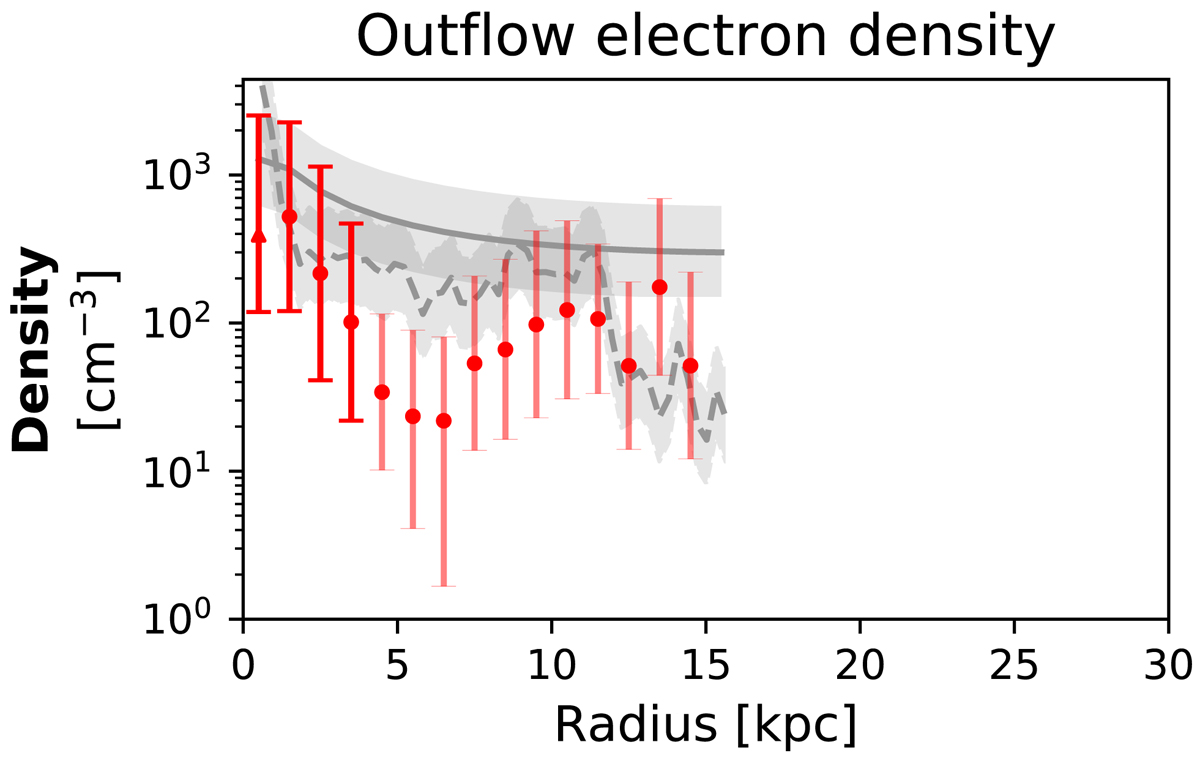
Fig. C.1.
Download original image
Radial profile of the ionised outflow electron density, obtained as the mean of the outflow densities (from the [S II] flux ratio of second plus third modelled components), weighted by the respective [S II] (λ6716+λ6731) fluxes of the outflow component(s), in each radial bin. We stress that the reported bars are not statistical errors but a combination of the statistical errors and the standard deviation of the values to show the extent of variation of the densities in each radial bin. Symbols and bar shading have the same meaning as in Fig. 8. Solid and dashed grey lines show the electron density profiles inferred from solving Eq. C.1, by employing the Q(H) radial profiles from Gagne et al. (2014) and Keel et al. (2017), respectively, with a typical uncertainty of ±0.3 dex (shown as light-grey shaded regions).
Current usage metrics show cumulative count of Article Views (full-text article views including HTML views, PDF and ePub downloads, according to the available data) and Abstracts Views on Vision4Press platform.
Data correspond to usage on the plateform after 2015. The current usage metrics is available 48-96 hours after online publication and is updated daily on week days.
Initial download of the metrics may take a while.