Fig. 3.
Download original image
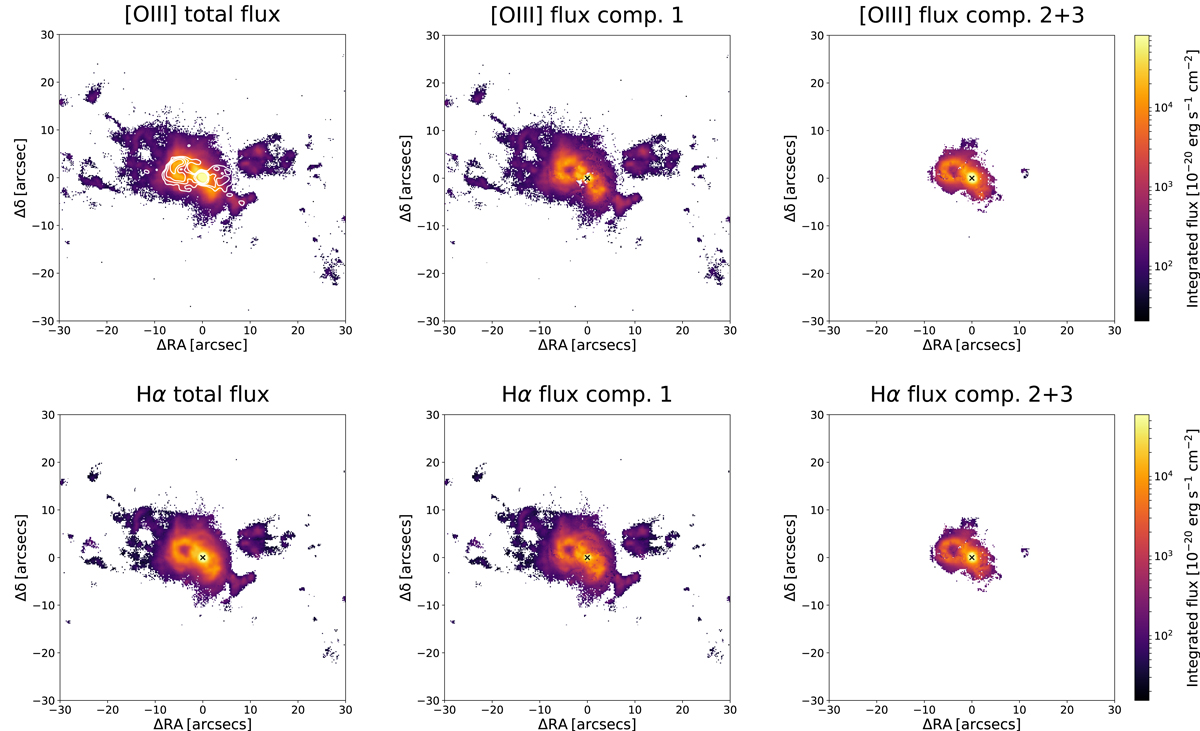
Maps of the [O III] (top panels) and Hα (bottom panels) emission line flux distribution in the Teacup galaxy. The fluxes of the total modelled line profile (left panels; same reported in Fig. 1) and of the first, narrower (centre panels) and the outflow (second plus third), broader Gaussian components (right panels) making up the total profile are reported. The colour intensity scale is the same for all the three maps of each line, as reported in the colour bar to the right. The contours in upper-left panel mark the VLA radio emission at 5.12 GHz from Harrison et al. (2015), same as in Fig. 1, right panel.
Current usage metrics show cumulative count of Article Views (full-text article views including HTML views, PDF and ePub downloads, according to the available data) and Abstracts Views on Vision4Press platform.
Data correspond to usage on the plateform after 2015. The current usage metrics is available 48-96 hours after online publication and is updated daily on week days.
Initial download of the metrics may take a while.