Fig. 4.
Download original image
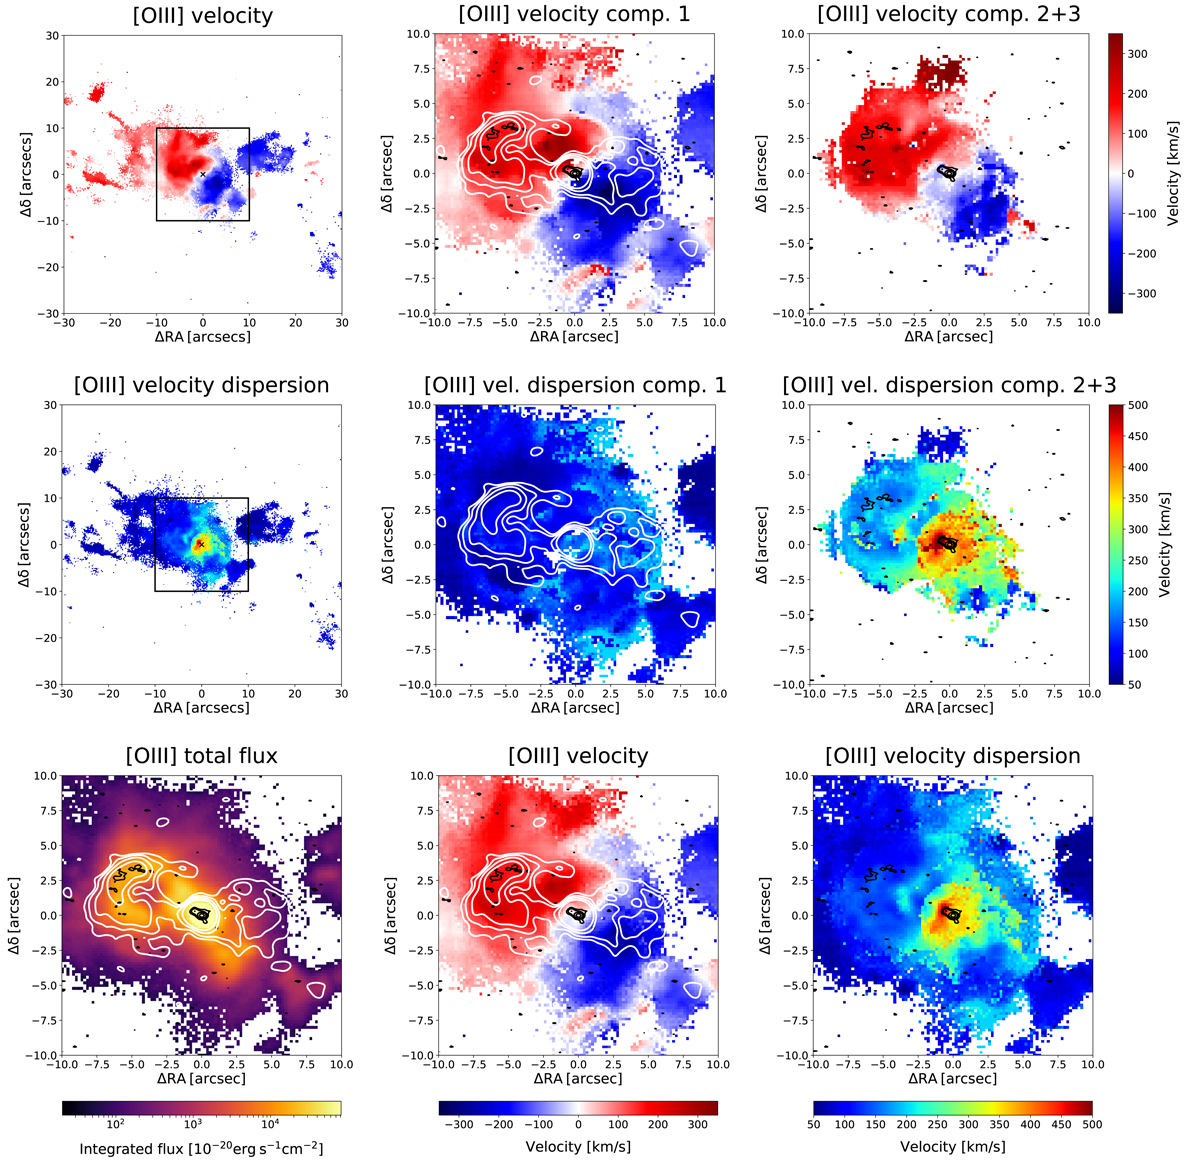
Ionised gas kinematic maps of the Teacup. [O III] velocity (upper panels) and velocity dispersion (middle panels), obtained as first- and second-order moments of the velocity, respectively, of the total modelled profile of [O III] (left panels), as well as for the first (central panels) and the second plus third Gaussian components (first- and second-order moments of velocity of their summed profile; right panels) employed for the line profile modelling. Central and right panels are zoomed in the central 20″ × 20″ (indicated by the black box in left panels). Bottom panels: zoomed versions (also in the central 20″ × 20″) of the [O III] flux (left; same as in Fig. 3, top-left panel), velocity (centre; same as in top-left panel) and velocity dispersion (right; same as in mid-left panel) maps for the total modelled emission line profile. The contours indicate the same VLA 5.12 GHz and highest-resolution 6.22 GHz radio images from Harrison et al. (2015) reported in Fig. 1, right panel, with the same contour levels.
Current usage metrics show cumulative count of Article Views (full-text article views including HTML views, PDF and ePub downloads, according to the available data) and Abstracts Views on Vision4Press platform.
Data correspond to usage on the plateform after 2015. The current usage metrics is available 48-96 hours after online publication and is updated daily on week days.
Initial download of the metrics may take a while.