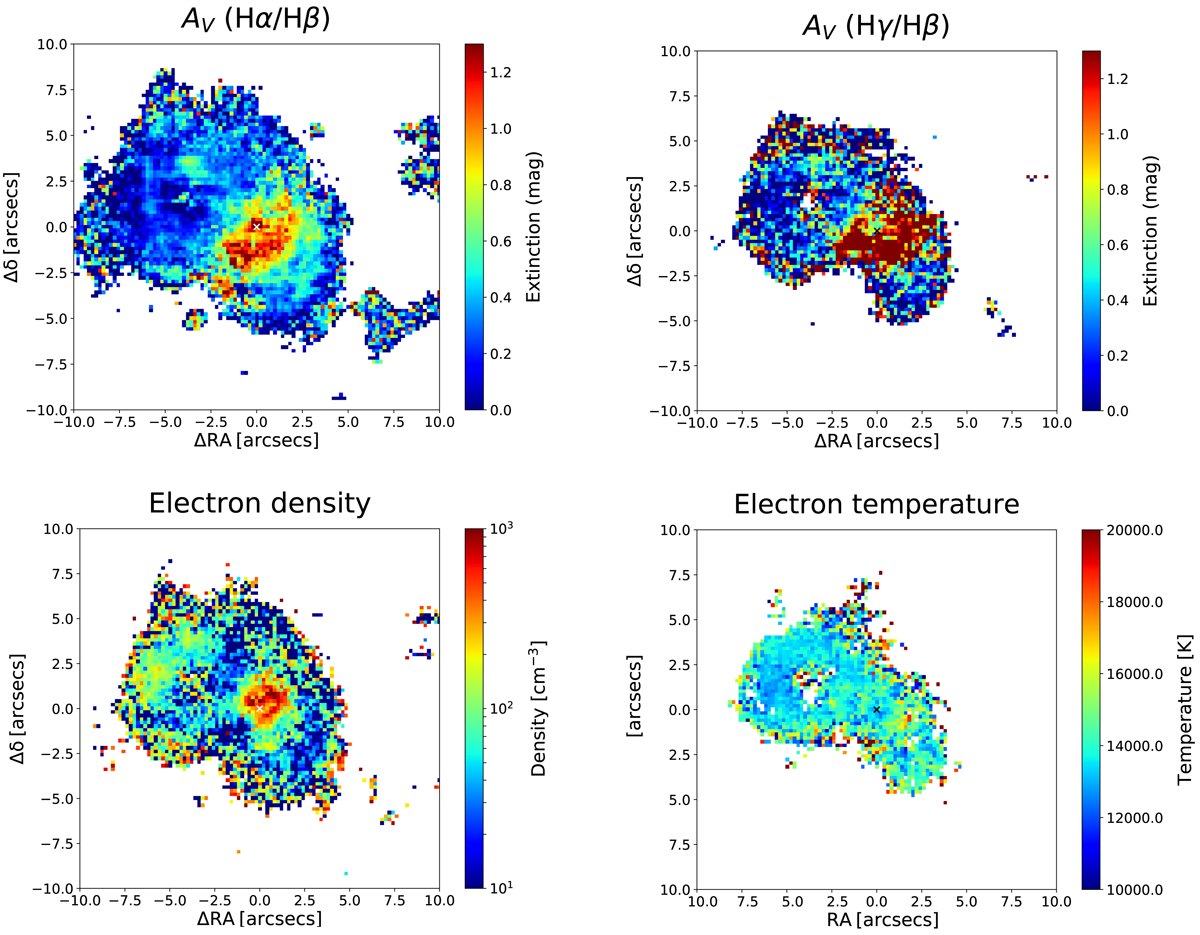
Fig. 5.
Download original image
Maps of physical properties of the ionised gas in the Teacup. Extinction AV from Hα/Hβ (top-left) and Hγ/Hβ (top-right), electron density (from [S II] λ6716/λ6731; bottom-left), and electron temperature (from [O III] (λ5007+λ4959)/λ4363; bottom-right). The line fluxes involved in the line ratios employed for the maps are those of the total modelled emission line profiles (with one, two, or three Gaussians). The maps are zoomed in the central 20″ × 20″.
Current usage metrics show cumulative count of Article Views (full-text article views including HTML views, PDF and ePub downloads, according to the available data) and Abstracts Views on Vision4Press platform.
Data correspond to usage on the plateform after 2015. The current usage metrics is available 48-96 hours after online publication and is updated daily on week days.
Initial download of the metrics may take a while.