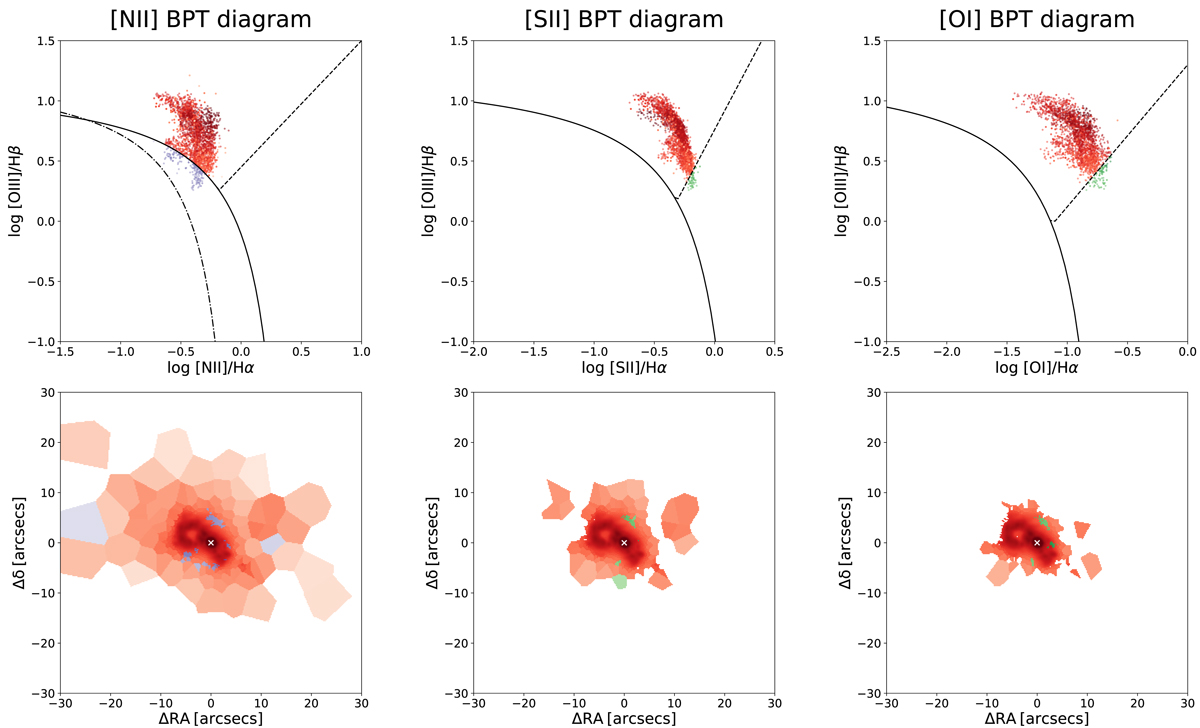
Fig. 6.
Download original image
Spatially resolved diagnostic diagrams of gas excitation for the Teacup, obtained from the star-subtracted Voronoi-binned data cube. [O III] λ5007/Hβ versus [N II] λ6584/Hα (top-left), versus [S II] (λ6716+λ6731)/Hα (top-centre), and versus [O I] λ6300/Hα (top-right) diagrams, together with their respective spatial distributions (bottom panels). The fluxes of the total modelled emission line profiles have been employed for the diagrams. The solid curve defines the theoretical upper bound for pure star formation from Kewley et al. (2001), while the dashed one in the [N II]-diagram is the Kauffmann et al. (2003) empirical classification. The dot-dashed line represents the demarcation line between Seyfert galaxies and shocks or LI(N)ERs from Schawinski et al. (2007) in the [N II]-diagram and from Kewley et al. (2006) in the [S II]- and [O I]-diagrams. Regions dominated by AGN ionisation are then marked in red, composite regions in the [N II]-diagram in purple, shock-ionised or LI(N)ER regions in green, and star formation-dominated regions would be marked in blue (when present).
Current usage metrics show cumulative count of Article Views (full-text article views including HTML views, PDF and ePub downloads, according to the available data) and Abstracts Views on Vision4Press platform.
Data correspond to usage on the plateform after 2015. The current usage metrics is available 48-96 hours after online publication and is updated daily on week days.
Initial download of the metrics may take a while.