Fig. 8.
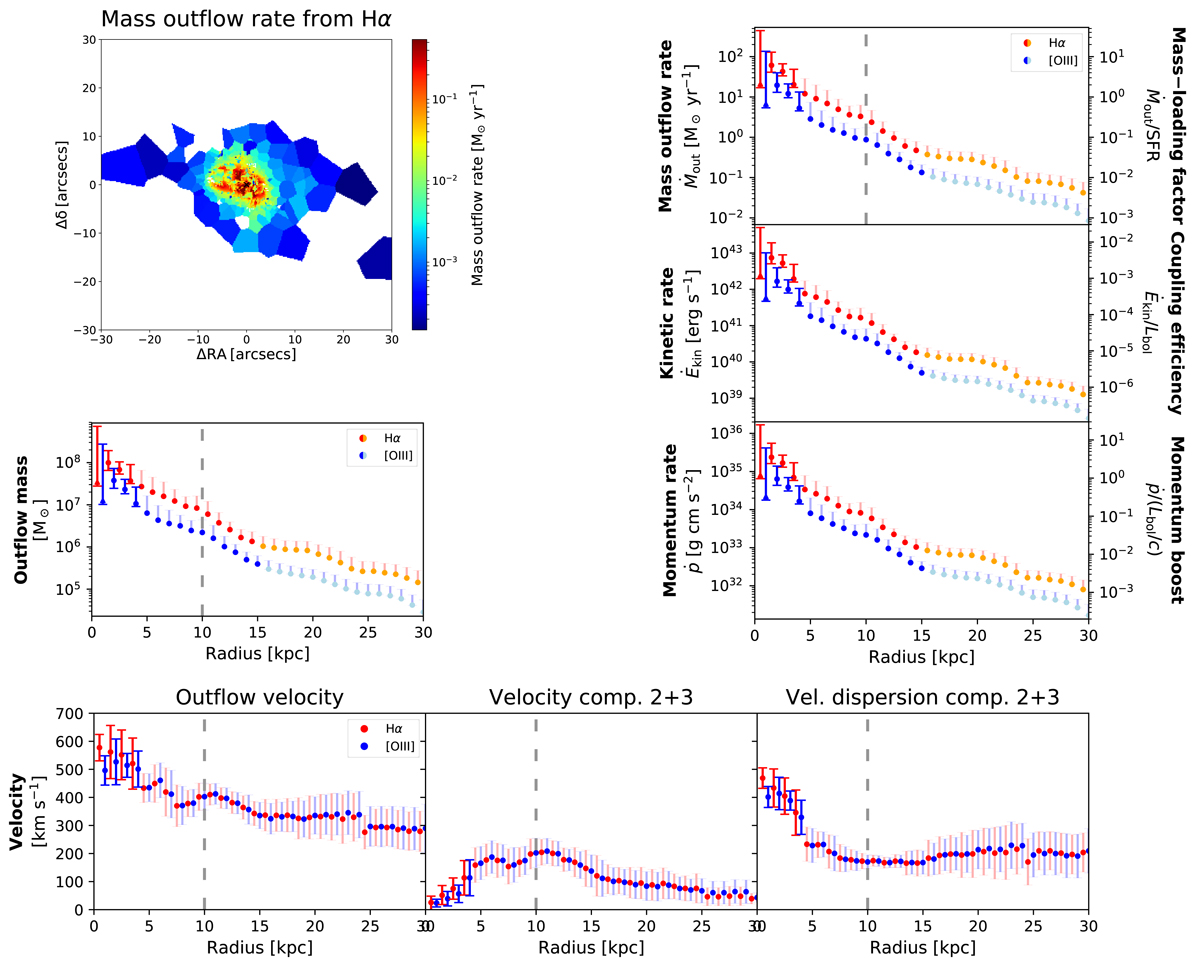
Download original image
Spatially resolved properties of the galactic ionised outflow in the Teacup. Top-left: mass outflow rate map, obtained from the outflow (second plus third) modelled component(s) of Hα. Top-right: radial profiles of mass outflow rate (top), kinetic rate (middle), and momentum rate (bottom) as a function of distance from the nucleus, from Hα (red and orange) and [O III] (blue and light blue) outflow components. These quantities were obtained by summing up the single-spaxel values (calculated through Eqs. (3), (5), and (6)) contained in each radial bin, and re-scaling by ΔR/ΔRradbin, being ΔRradbin the radial bin width (=1 kpc) and ΔR the spaxel size. Orange and light blue points mark those external radial bins for which we adopted a single median gas density, since no density measurement was available (see Sect. 4 for details). A different symbol is used for the innermost radial bin, which comprises a few spaxels whose outflow density could not be constrained (see Sect. 4). Lighter error bars are used when the assigned statistical uncertainties were estimated from representative regions instead of on a spaxel basis (see Sect. 4). The vertical dashed lines mark the distance of the handle. On the rightmost y axis, we also report mass-loading factor (top), coupling efficiency (middle), and momentum boost (bottom) of the outflow, for which we consider SFR ∼ 10 M⊙ and Lbol ∼ 5 × 1045 erg s−1 (see text). Mid-left: radial profiles of ionised outflow mass, from the flux of the outflow component(s) of Hα and [O III]. Bottom: radial profiles of outflow velocity (left; vout = v2 + 3 + FWHM2 + 3/2 ≃ 1.18σ2 + 3), combination of velocity, v2 + 3 (centre), and velocity dispersion, σ2 + 3 (right), of second plus third modelled components, for both [O III] and Hα. The reported values are the flux-weighted (by the outflow component(s)) averages in each radial bin. We stress that the reported error bars are not statistical errors, but are a combination of the statistical errors and the standard deviation of the values, to show the extent of variation of the velocities in each radial bin.
Current usage metrics show cumulative count of Article Views (full-text article views including HTML views, PDF and ePub downloads, according to the available data) and Abstracts Views on Vision4Press platform.
Data correspond to usage on the plateform after 2015. The current usage metrics is available 48-96 hours after online publication and is updated daily on week days.
Initial download of the metrics may take a while.