Open Access
Fig. 9.
Download original image
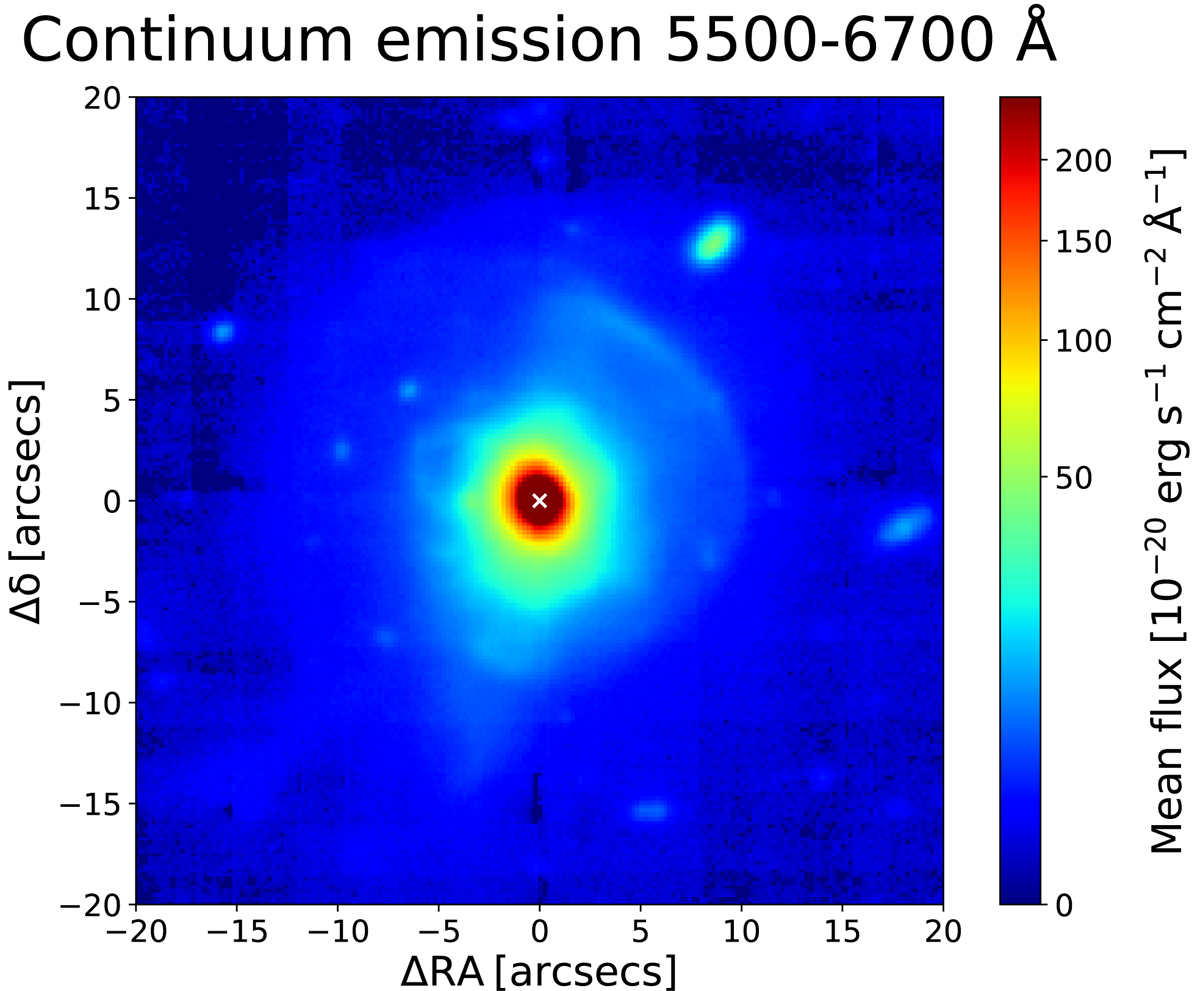
Map of continuum emission, obtained by averaging the (observed) spectral channels of the data cube between 5500–6700 Å, free from the strongest gas emission lines (same as in Fig. 1, left panel, here zoomed in the central 40″ × 40″).
Current usage metrics show cumulative count of Article Views (full-text article views including HTML views, PDF and ePub downloads, according to the available data) and Abstracts Views on Vision4Press platform.
Data correspond to usage on the plateform after 2015. The current usage metrics is available 48-96 hours after online publication and is updated daily on week days.
Initial download of the metrics may take a while.