Fig. 2.
Download original image
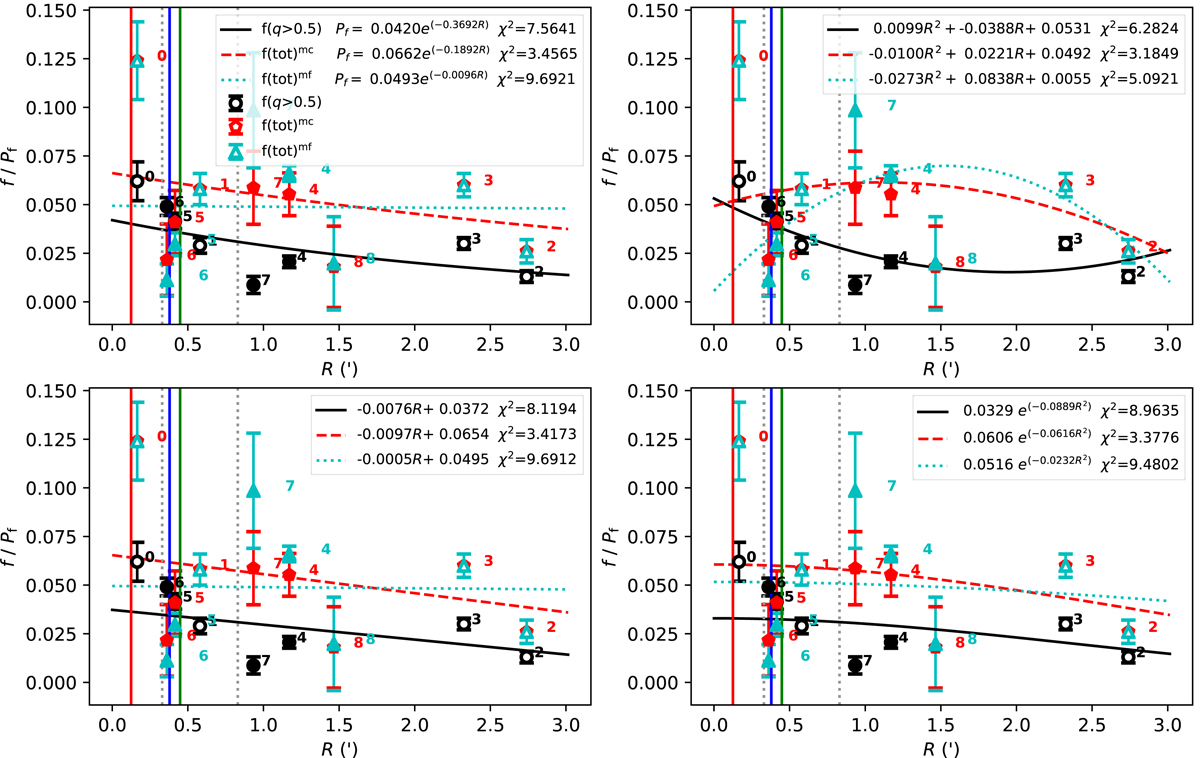
Three sets of the measured binary fractions (f(i, j, kf)) along the radial direction (R, in arcmin) and its corresponding derived binary-fraction profile (Pf(i, j, kf, kff)) shown in each panel and including the equivalent radius (RS, equ(i, j′)) for NGC 6637. From the top-left to the bottom-right: the four panels are for the exponential, quadratic, linear, and Gaussian binary-fraction profiles, i.e., kff = 0,1,2,3. In each panel, the measured binary fraction results are shown as symbols, with their observed regions are represented with the numbers to the right of the symbols, the fitted binary-fraction profiles are in curves, its derived expressions and their χ2 results (Eq. (7)) are given in the top-right corner, and the equivalent radii are in vertical solid lines. A. On the measured binary fraction, (i) the data used in the fitting process is given as small symbols, the color and shape of symbols representing the binary fraction type (black-circles: f(q > 0.5), red-pentagons: f(tot)mc, cyan-triangles: f(tot)mf), whether the symbol is filled stands for its reference (open: M12, solid: M16); (ii) the data for comparisons, relating to f(tot), is in large transparent symbols (no comparison data for this sample), S07’s f(tot)min, f(tot)qf, and f(tot)qr are in black-circles, cyan-diamonds and red-pentagons, and R12’s f(tot)min, f(tot)max, and f(tot) are in black-circles, cyan-diamonds and red-pentagons. B. On the observed region of binary fraction data, (i) the numbers ‘0’–‘3’, to the right of the symbol, indicate the M12’ and M16’s four regions (see row 2 of Table 2, we do not give the numbers ‘0’–‘3’ for f(tot)mf (cyan) because the regions are the same as f(tot)mc (red)); (ii) the numbers ‘4’–‘8’ indicate the J15’s five regions (see row 3 of Table 2); and (iii) the number ‘0*’ indicates the S07’s region of < RC, ‘1*’–‘4*’ are for four regions of R12 (see the last row of Table 2). 1*, 2* and 4* regions correspond to 0, 1 and 3 regions, 3* region (< RHM) is similar to 4 region (< RHL), so we add the text ‘(0), (1), (4), (3)’ after the text ‘1*, 2*, 3*, 4*’ (for the sake of comparison). C. On the fitted Pf(i, j, kf, kff), RS, equ(i, j′), RC and RHM, (i) the black-solid, red-dashed and cyan-dotted curves are the fitted Pf(i, j, kf, kff) in the cases of f(q > 0.5), f(tot)mc, and f(tot)mf, respectively; (ii) the vertical solid lines are the RS, equ(i, j′) of P02 (black), U17 (blue), S05-1 (green), S05-2 (red), and S05-03 (cyan, not exist for this sample); and (iii) the vertical dotted lines are for RC (grey, left) and RHM (grey, right).
Current usage metrics show cumulative count of Article Views (full-text article views including HTML views, PDF and ePub downloads, according to the available data) and Abstracts Views on Vision4Press platform.
Data correspond to usage on the plateform after 2015. The current usage metrics is available 48-96 hours after online publication and is updated daily on week days.
Initial download of the metrics may take a while.