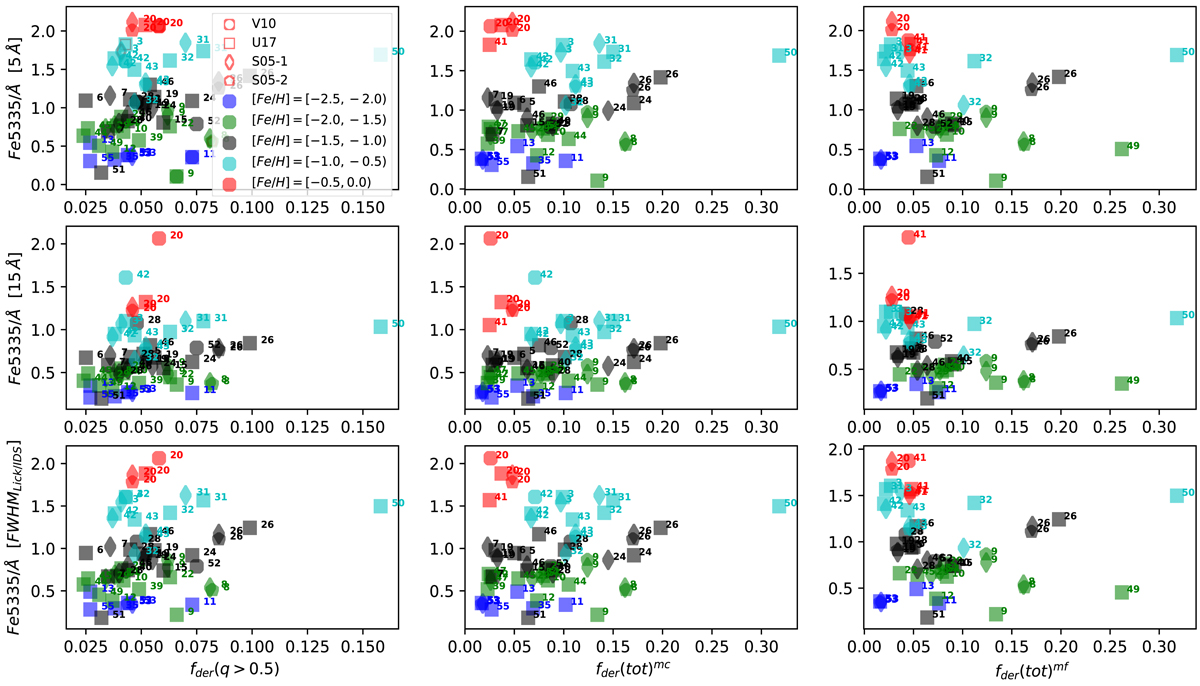
Fig. 3.
Download original image
Distribution of GCs on the derived binary fraction (fder(q > 0.5), fder(tot)mc, and fder(tot)mf, from the left to right columns) and Fe5335 (in Å) plane. The rows 1–3 are for the resolutions of FWHM = 5 Å, 15 Å and FWHMLick/IDS. In each panel, the color of symbols is for metallicity: blue, green, black, cyan, and red are for the ranges of [Fe/H] = [−2.5, −2.0), [−2.0, −1.5), [−1.5, −1.0), [−1.0, −0.5), and [−0.5, 0.0), the shape of symbols is for its spectrum region: circle, rectangle, diamond, and pentagon correspond to those in the V10 (P02), U17, S05-1, and S05-2 observations, and the numbers to the right of symbols is the GC number.
Current usage metrics show cumulative count of Article Views (full-text article views including HTML views, PDF and ePub downloads, according to the available data) and Abstracts Views on Vision4Press platform.
Data correspond to usage on the plateform after 2015. The current usage metrics is available 48-96 hours after online publication and is updated daily on week days.
Initial download of the metrics may take a while.