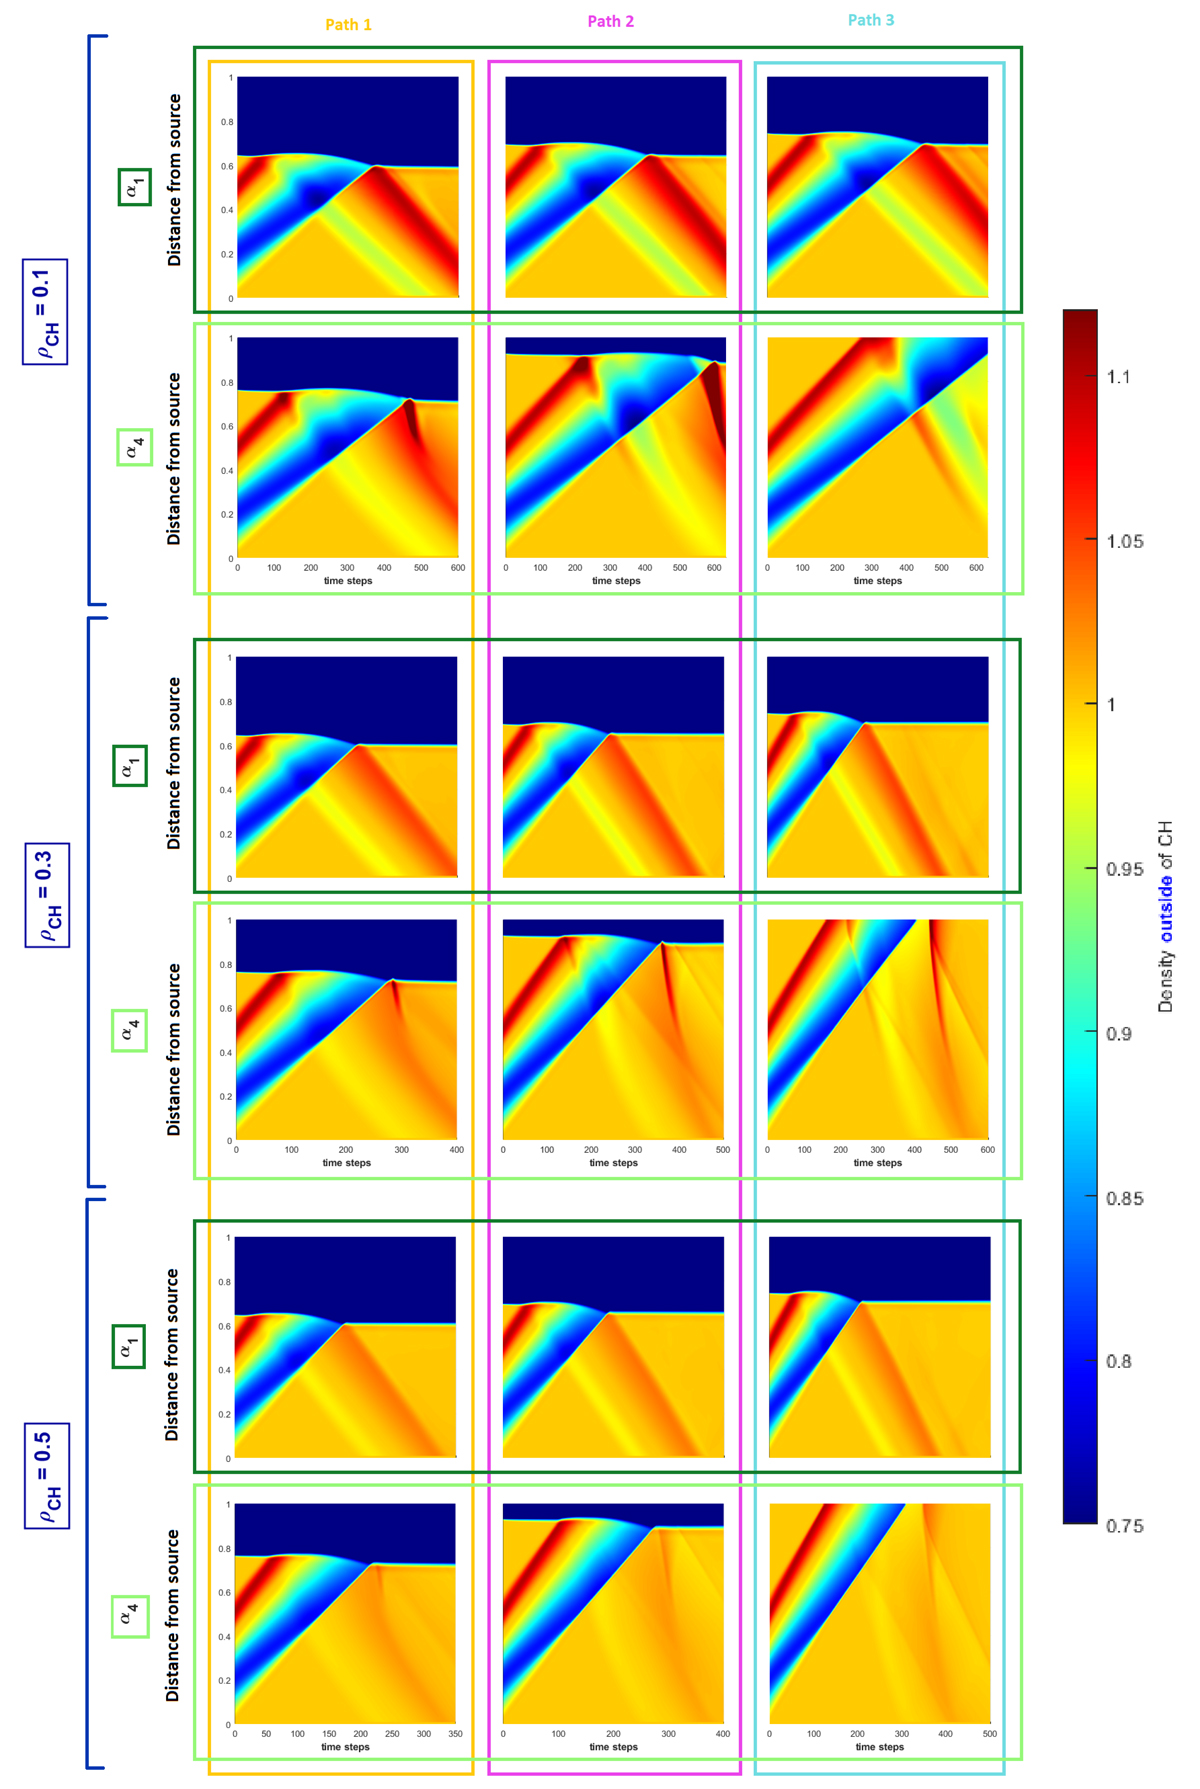
Fig. 12.
Download original image
Time-distance plots for the smallest and the largest incident angle, α1 and α4, along the three different paths (path 1, path 2, and path 3), and for three different CH densities, ρCH = 0.1, ρCH = 0.3, and ρCH = 0.5. The amplitudes of the initial density profile are ρIAE = 1.1 and ρIAD = 0.8, the initial widths are wE = 0.1, and wD = 0.2, and we used a constant CH density, ρCH = 0.1.
Current usage metrics show cumulative count of Article Views (full-text article views including HTML views, PDF and ePub downloads, according to the available data) and Abstracts Views on Vision4Press platform.
Data correspond to usage on the plateform after 2015. The current usage metrics is available 48-96 hours after online publication and is updated daily on week days.
Initial download of the metrics may take a while.