Fig. 1
Download original image
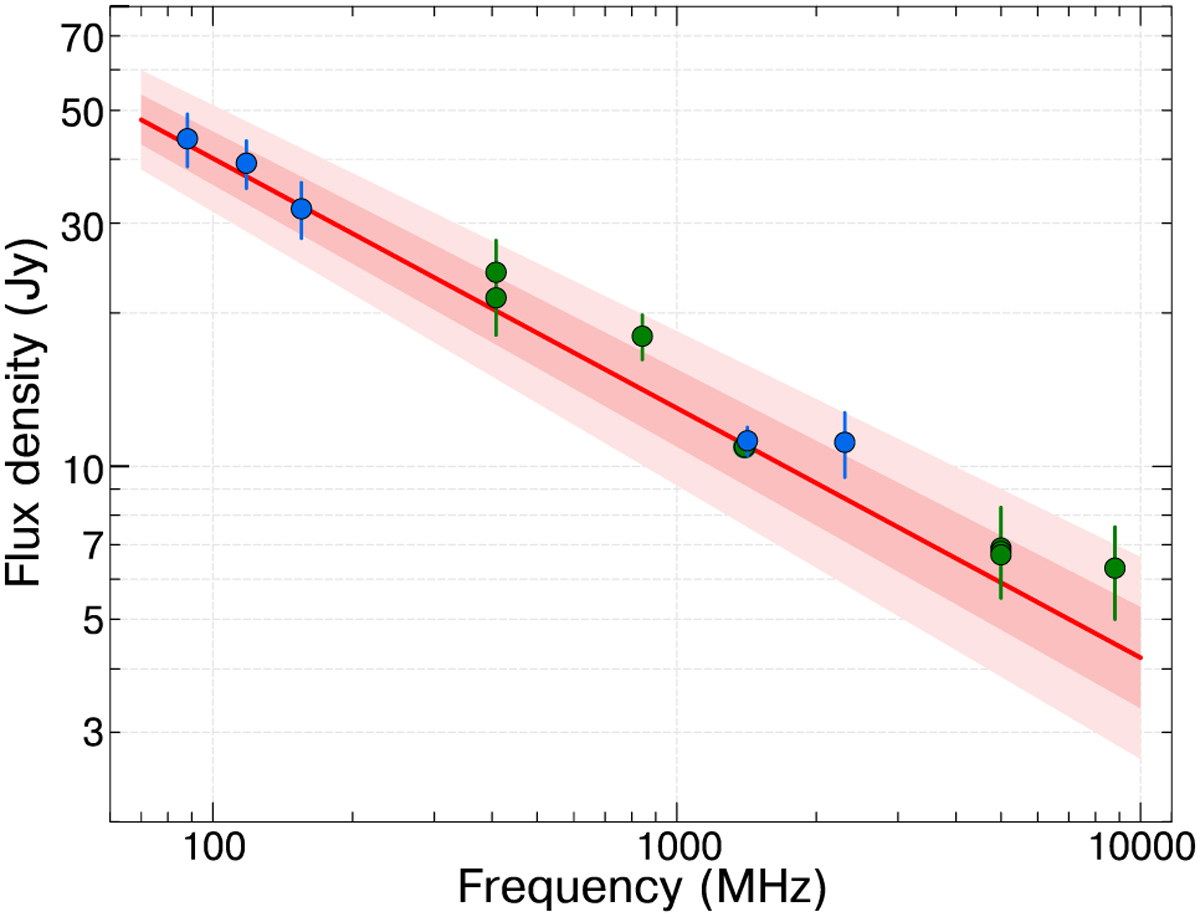
Spectrum of the continuum emission from SNR Kes 17 at radio frequencies, constructed with the fluxes in Table 1. Blue data points denote our new measurements from public survey images, and the green points correspond to literature flux estimates. The straight line represents the best fit with a power-law model in the form Sν ∝ να, which yields a spectral index value α = −0.488 ± 0.023. The shaded darker and lighter pink regions around the straight line denote a variation in the fitted spectral parameters of 1 and 2σ, respectively.
Current usage metrics show cumulative count of Article Views (full-text article views including HTML views, PDF and ePub downloads, according to the available data) and Abstracts Views on Vision4Press platform.
Data correspond to usage on the plateform after 2015. The current usage metrics is available 48-96 hours after online publication and is updated daily on week days.
Initial download of the metrics may take a while.