Fig. 3
Download original image
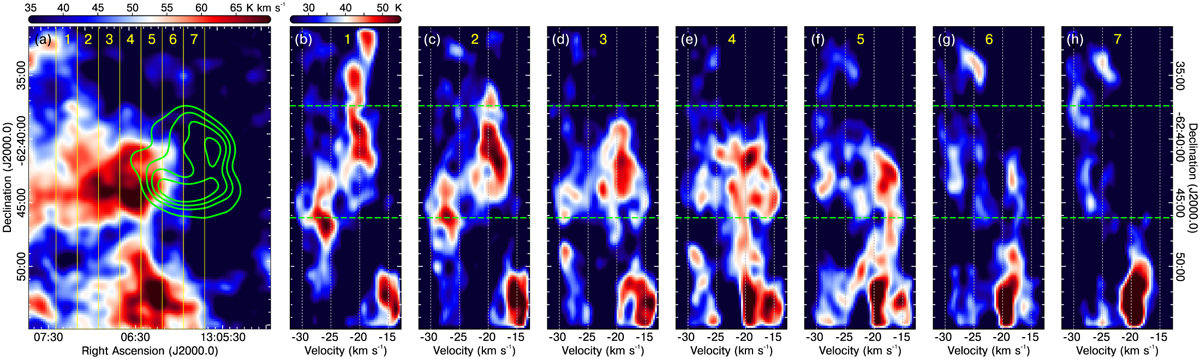
Position-velocity (p-υ) diagrams for the 12CO emission towards the field of Kes 17. (a) Regions numbered from 1 to 7 that were used to construct the p-υ diagrams for the eastern cloud associated with Kes 17, shown in panels b–h. The colours indicate the spatial distribution of the 12CO J =1–0 gas integrated in the (−31, −14) km s−1 velocity range as in Fig. 2, and the contours trace the 843 MHz radio continuum emission from Kes 17. (b–h) p-υ diagrams derived from the 12CO line emission depicted in panel a. They were constructed by integrating in the 100″ RA interval indicated by the regions numbered from 1 to 7 in panel a. The horizontal dashed lines mark the extent of Kes 17 in the declination dimension. The colour representation is the same for all p-υ diagrams.
Current usage metrics show cumulative count of Article Views (full-text article views including HTML views, PDF and ePub downloads, according to the available data) and Abstracts Views on Vision4Press platform.
Data correspond to usage on the plateform after 2015. The current usage metrics is available 48-96 hours after online publication and is updated daily on week days.
Initial download of the metrics may take a while.