Fig. 11
Download original image
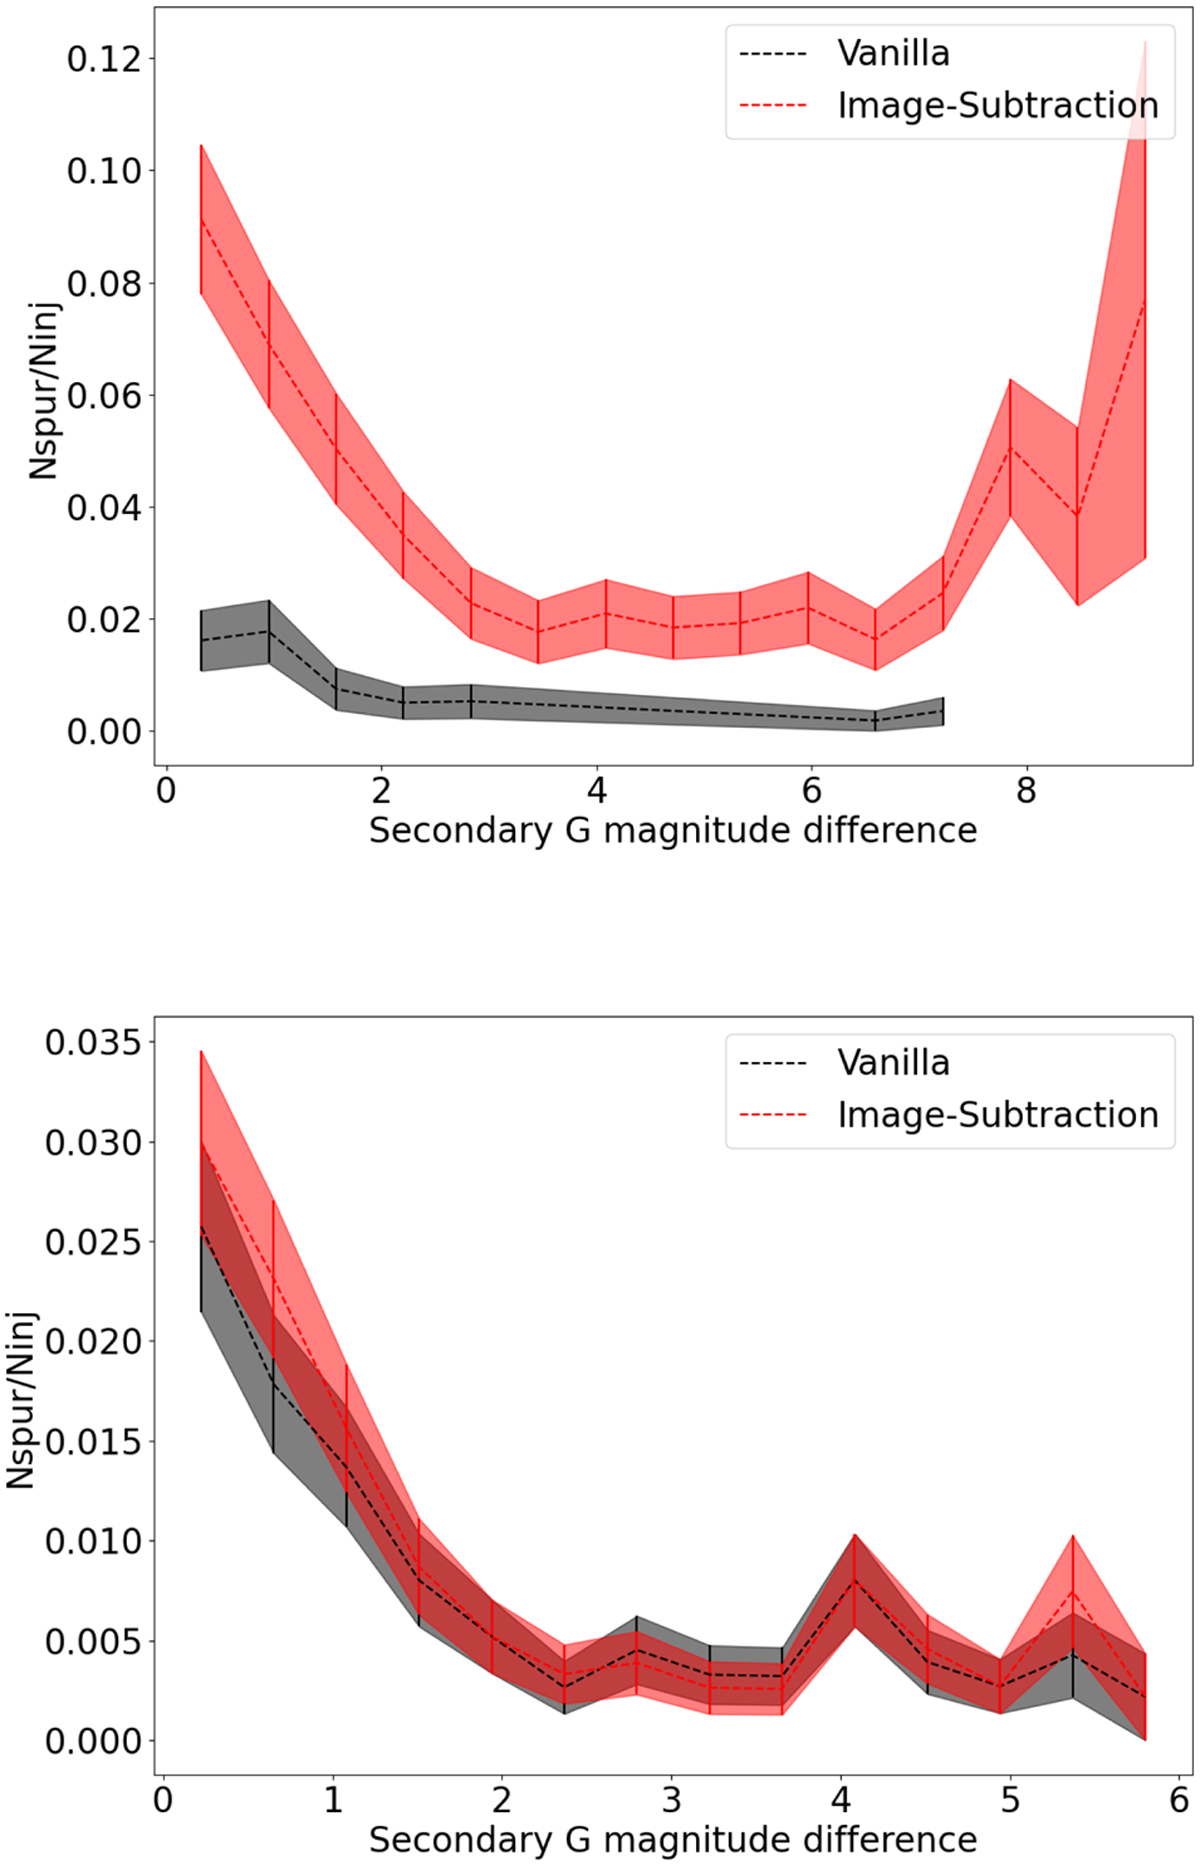
Spurious rate, the number of spurious detections as a fraction of the number of secondaries injected, as a function of the magnitude difference between the primary and the injected secondary. Top: primary sources in the G magnitude range 13.5–15.5. Bottom: primary sources in the G magnitude range 16.0–18.0. The rates in both the image-subtraction and vanilla pipelines are shown. The shaded areas enclose the 1σ errors in the spurious rate. We see that there is an increase in the chance of a spurious detection, if there is a low magnitude difference companion.
Current usage metrics show cumulative count of Article Views (full-text article views including HTML views, PDF and ePub downloads, according to the available data) and Abstracts Views on Vision4Press platform.
Data correspond to usage on the plateform after 2015. The current usage metrics is available 48-96 hours after online publication and is updated daily on week days.
Initial download of the metrics may take a while.