Open Access
Fig. 12
Download original image
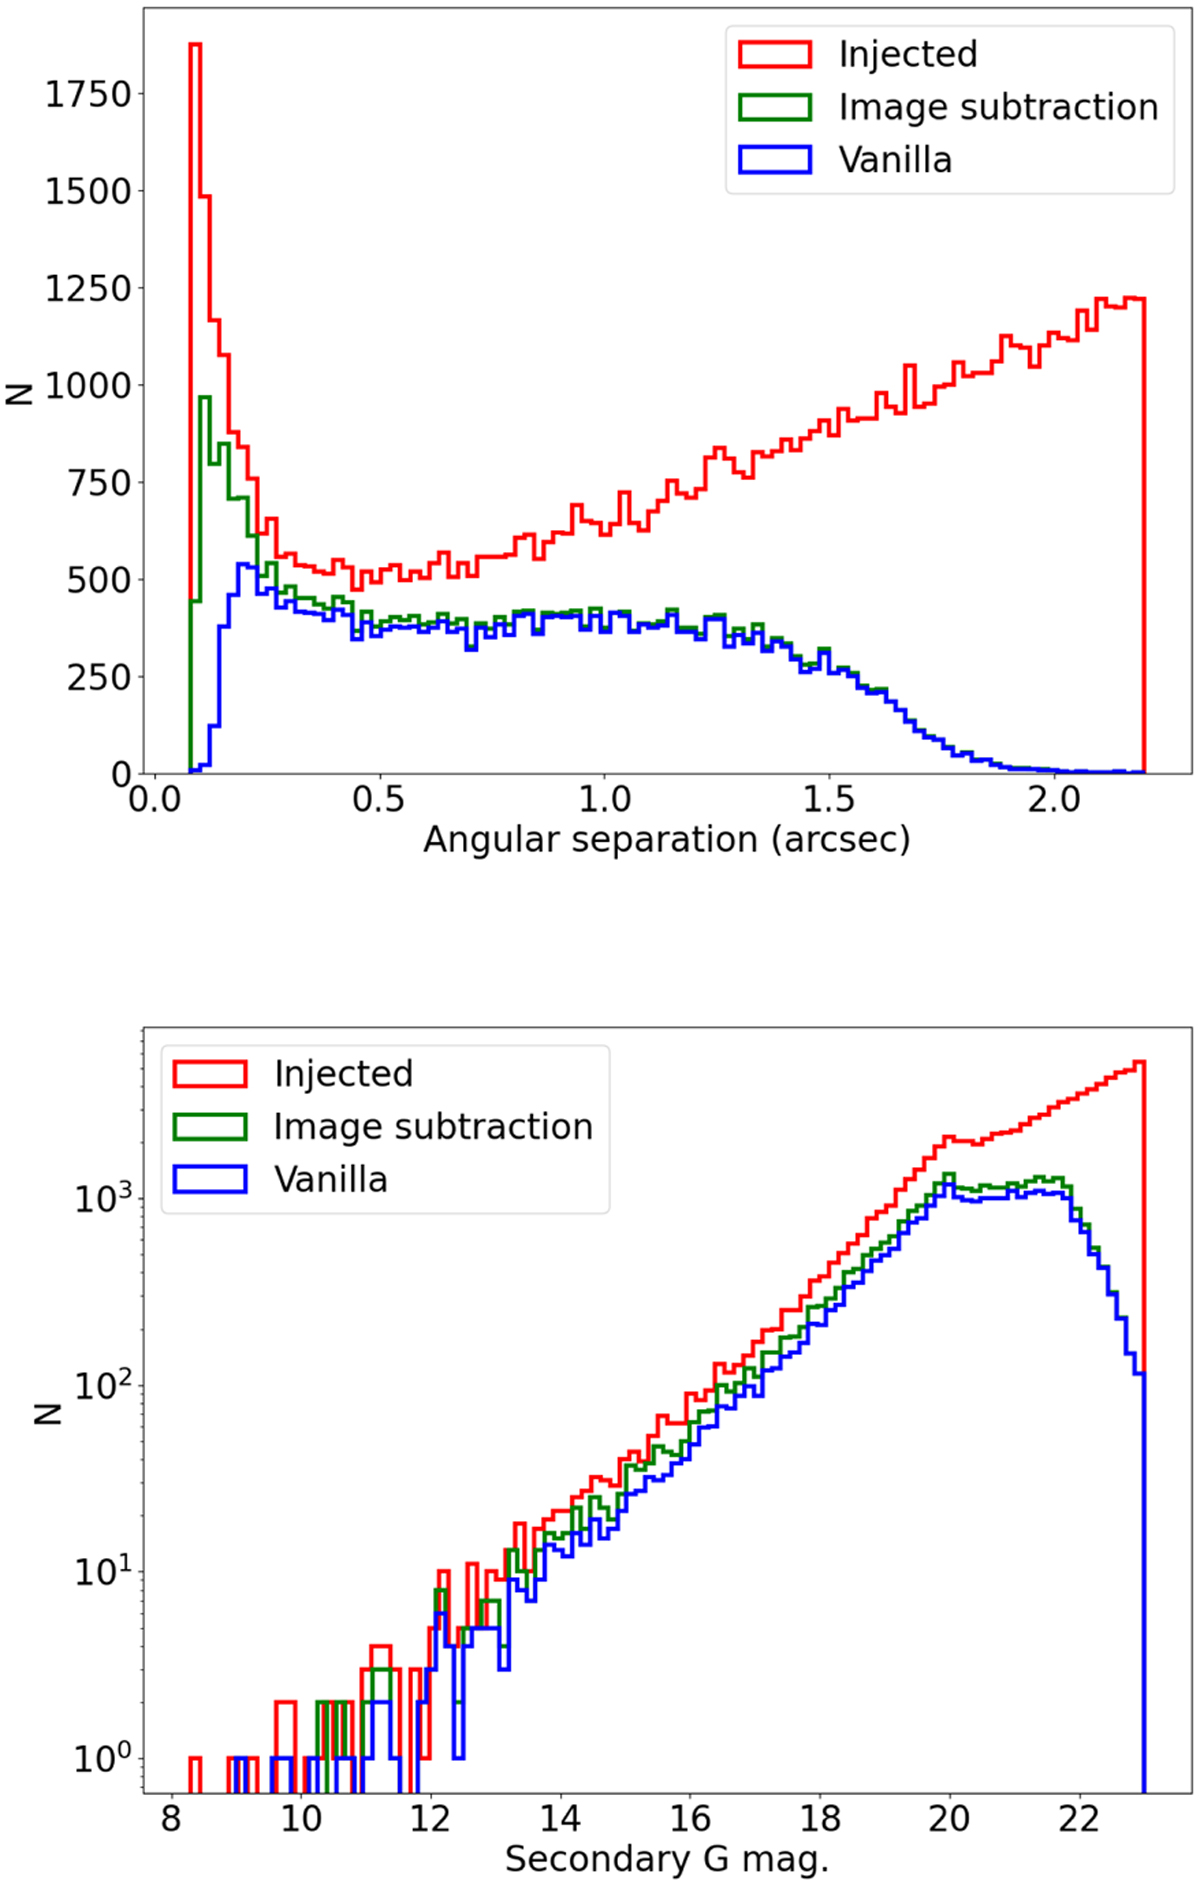
Injected secondaries (drawn from the true underlying distribution of secondary sources) and those recovered by the vanilla and the image-subtraction pipelines as a function of their angular separation from the primary source (top) and their G magnitude (bottom).
Current usage metrics show cumulative count of Article Views (full-text article views including HTML views, PDF and ePub downloads, according to the available data) and Abstracts Views on Vision4Press platform.
Data correspond to usage on the plateform after 2015. The current usage metrics is available 48-96 hours after online publication and is updated daily on week days.
Initial download of the metrics may take a while.