Fig. 2
Download original image
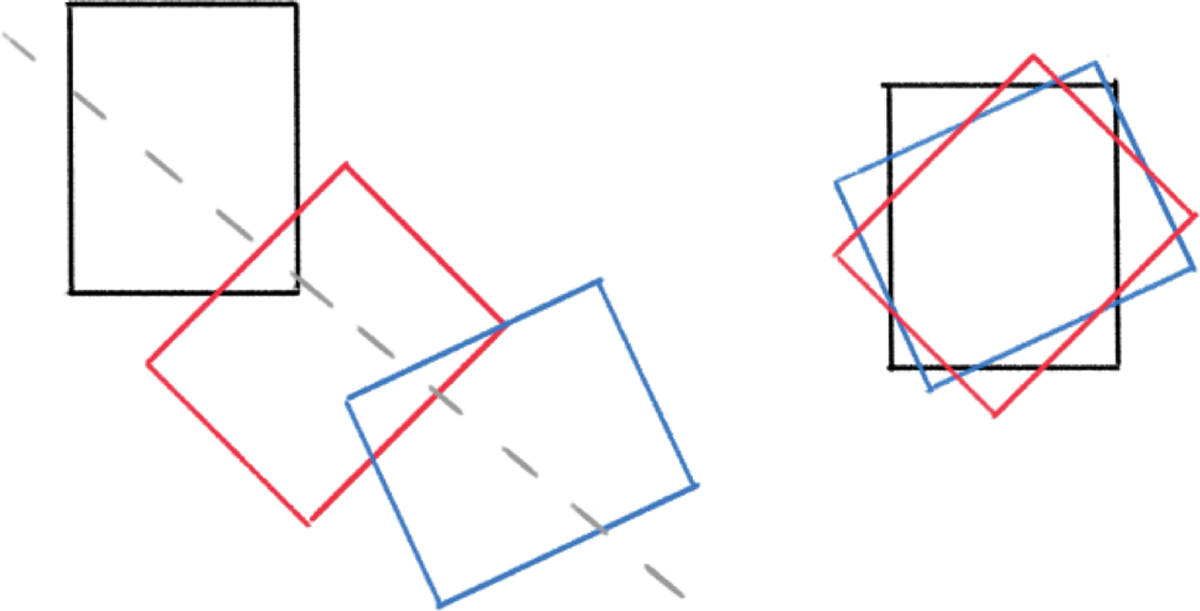
Path of the primary source on the sky is indicated by the dashed grey line on the left, and windows at three different epochs by the coloured rectangles. In order to obtain a two dimensional reconstructed image of this source we need to stack on the position of the source in each window as indicated on the right. We note that the location of the windows for the source on the left is exaggerated for the majority of sources and only reflects the situation for high proper motion sources. However, smaller proper motions could still cause issues, and result in a blurring of the source in the image and a point source could be mistakenly classified as extended. All images are hence formed though stacking on the position of the source in each window.
Current usage metrics show cumulative count of Article Views (full-text article views including HTML views, PDF and ePub downloads, according to the available data) and Abstracts Views on Vision4Press platform.
Data correspond to usage on the plateform after 2015. The current usage metrics is available 48-96 hours after online publication and is updated daily on week days.
Initial download of the metrics may take a while.