Fig. 3
Download original image
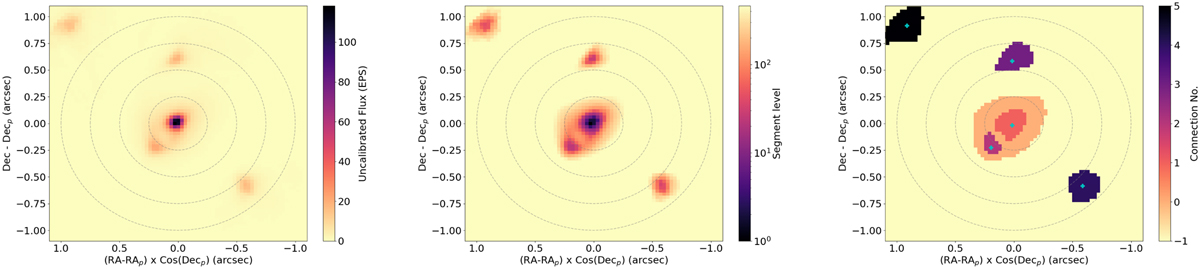
Example reconstructed, segmented, and segregated images. Left: reconstructed image of a G = 14.0 magnitude primary source, located at (RAp,Decp), into whose data four secondary sources, all 2 magnitudes fainter, have been injected. Centre: segmented image, the segment containing the brightest pixel is labelled 1. For clarity, the threshold level at which the segmentation stops has been increased for this plot, and a log-scale is used. Right: segregated image, here the blue crosses indicate the positions returned for the sources found in this image. A connection number of −1 or 0 means this image pixel belongs to the background and not a source. In all panels, the grey dashed circles indicate angular separations of 0.25, 0.50, 0.75, and 1.0″ from the centre of the image (and primary source position).
Current usage metrics show cumulative count of Article Views (full-text article views including HTML views, PDF and ePub downloads, according to the available data) and Abstracts Views on Vision4Press platform.
Data correspond to usage on the plateform after 2015. The current usage metrics is available 48-96 hours after online publication and is updated daily on week days.
Initial download of the metrics may take a while.