Fig. 9
Download original image
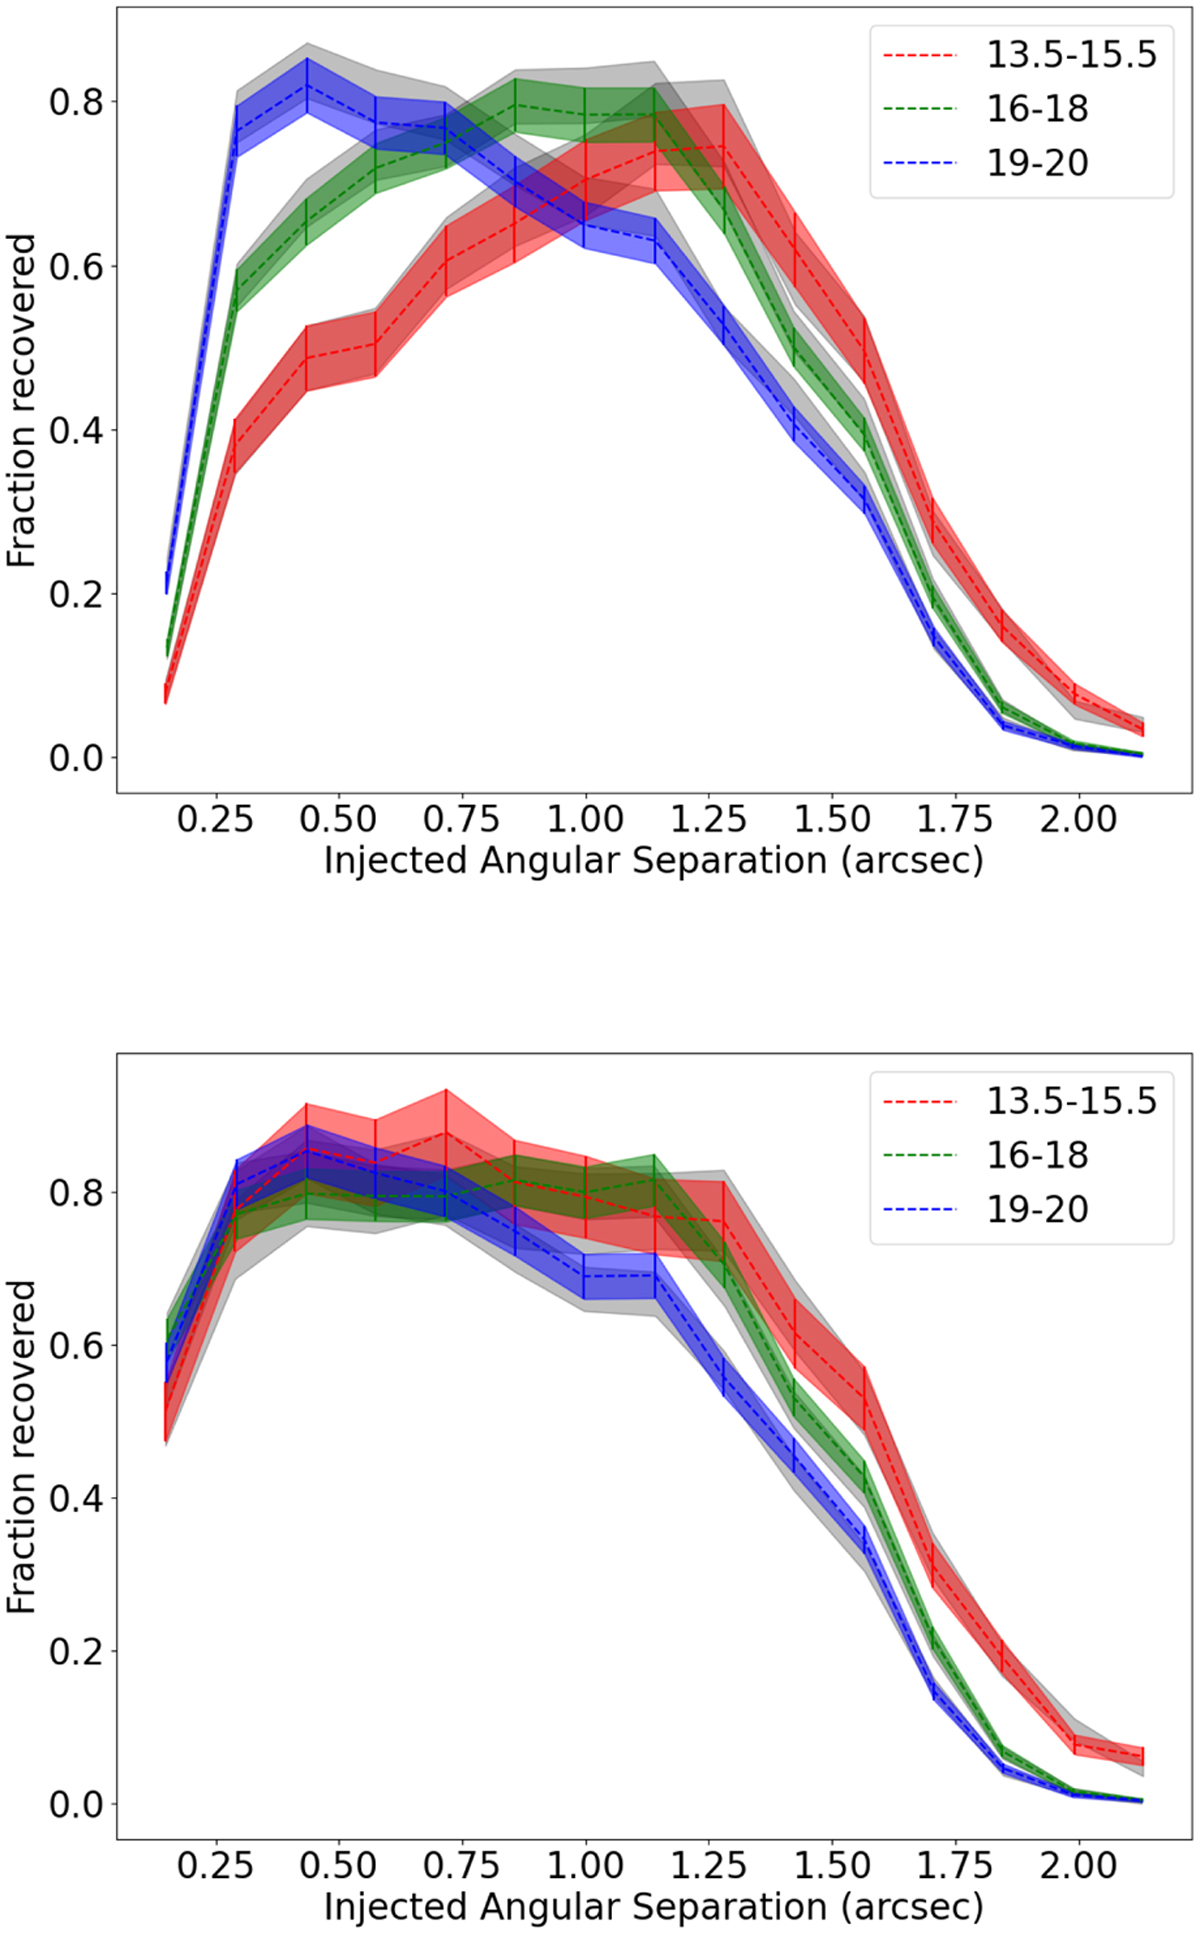
Fraction of the sources which are recovered as a function of their injected angular separation from the primary source. Top: vanilla pipeline. Bottom: image-subtraction pipeline. The colours correspond to the magnitude range of the primary sources into which the sources were injected. The shaded areas enclose the 1 errors in the recovered fraction. The shaded grey areas under the coloured areas correspond to injection into the real data, (the coloured area corresponds to injection into the mock data).
Current usage metrics show cumulative count of Article Views (full-text article views including HTML views, PDF and ePub downloads, according to the available data) and Abstracts Views on Vision4Press platform.
Data correspond to usage on the plateform after 2015. The current usage metrics is available 48-96 hours after online publication and is updated daily on week days.
Initial download of the metrics may take a while.