Fig. 1.
Download original image
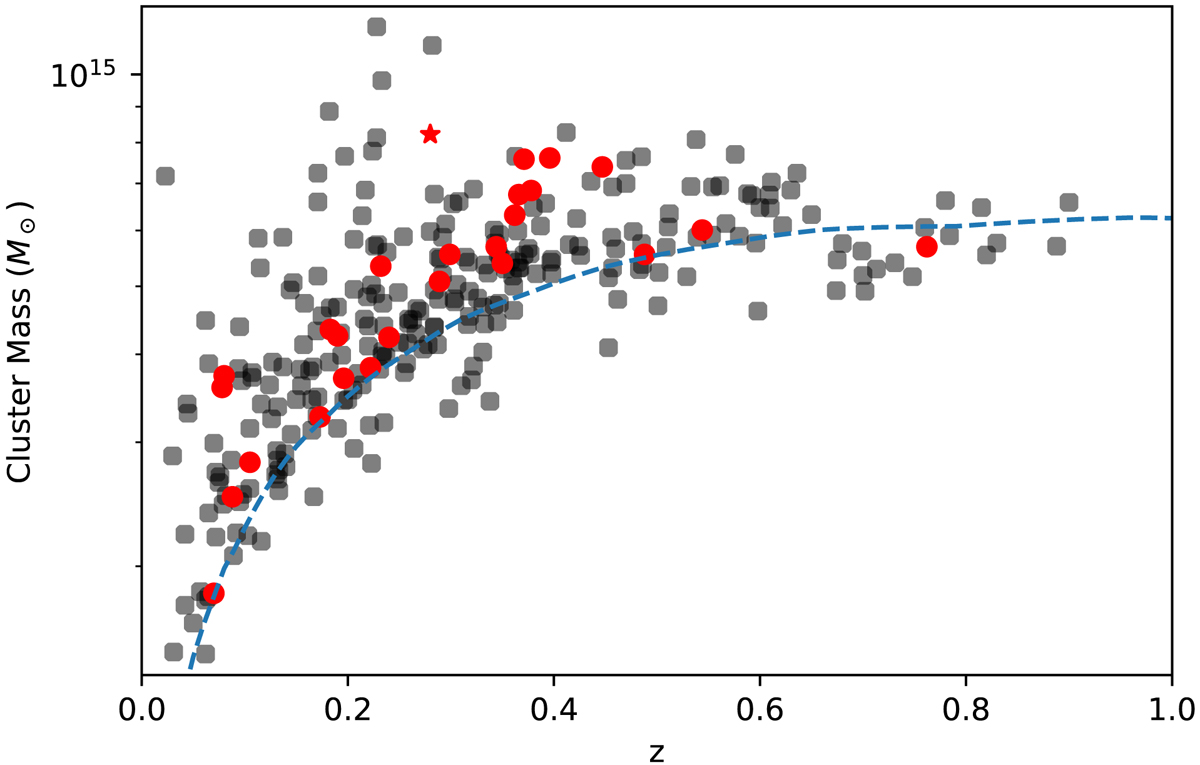
Cluster M500 mass vs. redshift for all clusters in the LoTSS DR2 – PSZ2 sample. Red circles denote clusters which host at least one RR. Black circles denote all other clusters in the LoTSS DR2 – PSZ2 sample (Botteon et al. 2022). PSZ2 G107.10+65.32 S is plotted as a red star, since the mass reported in the PSZ2 catalogue likely comes from both sub-clusters, PSZ2 G107.10+65.32 N and PSZ2 G107.10+65.32 S. The 50% PSZ2 completeness line is shown in blue.
Current usage metrics show cumulative count of Article Views (full-text article views including HTML views, PDF and ePub downloads, according to the available data) and Abstracts Views on Vision4Press platform.
Data correspond to usage on the plateform after 2015. The current usage metrics is available 48-96 hours after online publication and is updated daily on week days.
Initial download of the metrics may take a while.