Fig. 10.
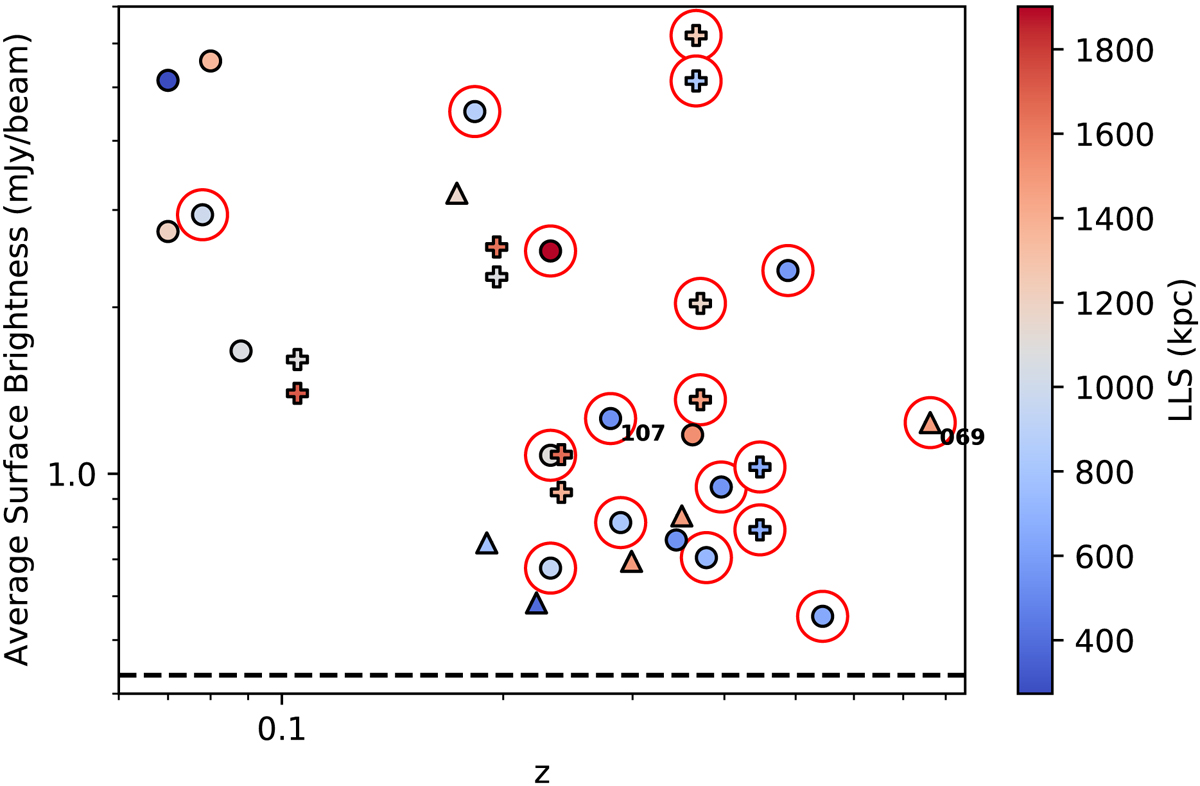
Download original image
Average relic surface brightness vs. redshift. The colour of the points shows the relic LLS. Triangles denote candidate relics and plusses those relics which are part of a double relic pair. All other relics are plotted as circles. Red circles surround relics in clusters which also host a RH. PSZ2 G069.39+68.05 and PSZ2 G107.10+65.32 are labelled, with the labels below and right of the data points. The dotted black line is at 2σ50 kpc, where σ50 kpc = 0.216 mJy beam−1 is the average rms noise of the 50 kpc-tapered images in our sample.
Current usage metrics show cumulative count of Article Views (full-text article views including HTML views, PDF and ePub downloads, according to the available data) and Abstracts Views on Vision4Press platform.
Data correspond to usage on the plateform after 2015. The current usage metrics is available 48-96 hours after online publication and is updated daily on week days.
Initial download of the metrics may take a while.