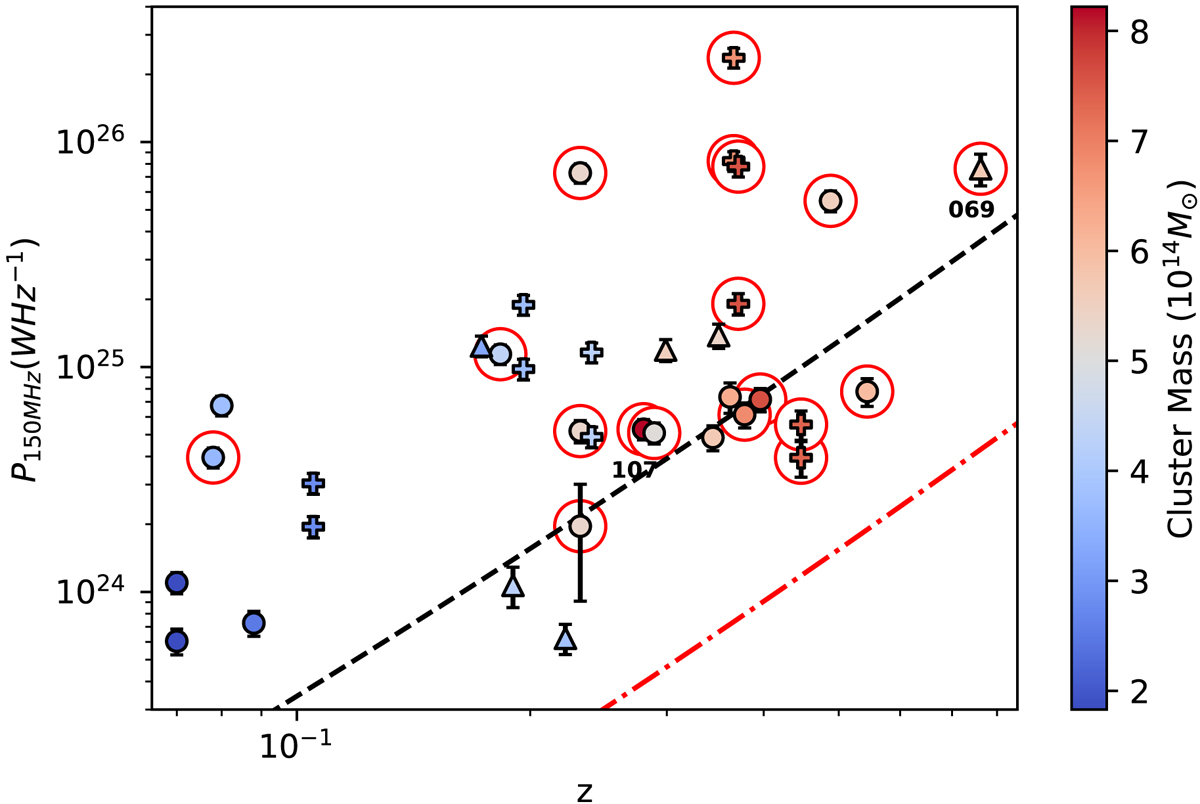
Fig. 11.
Download original image
Relic power vs. cluster redshift. The colour of the points shows the cluster mass. Plusses denote relics which are part of a double relic pair. All other relics are plotted as circles. Red circles surround relics in clusters which also host a RH. The black (dashed) and red (dot-dashed) lines show the estimated detection limit for the median (∼1100 kpc × 200 kpc) and minimum (∼300 kpc × 100 kpc) relic LLSs and widths of our sample, respectively. PSZ2 G069.39+68.05 and PSZ2 G107.10+65.32 are labelled, with the labels directly below the data points.
Current usage metrics show cumulative count of Article Views (full-text article views including HTML views, PDF and ePub downloads, according to the available data) and Abstracts Views on Vision4Press platform.
Data correspond to usage on the plateform after 2015. The current usage metrics is available 48-96 hours after online publication and is updated daily on week days.
Initial download of the metrics may take a while.