Open Access
Fig. 12.
Download original image
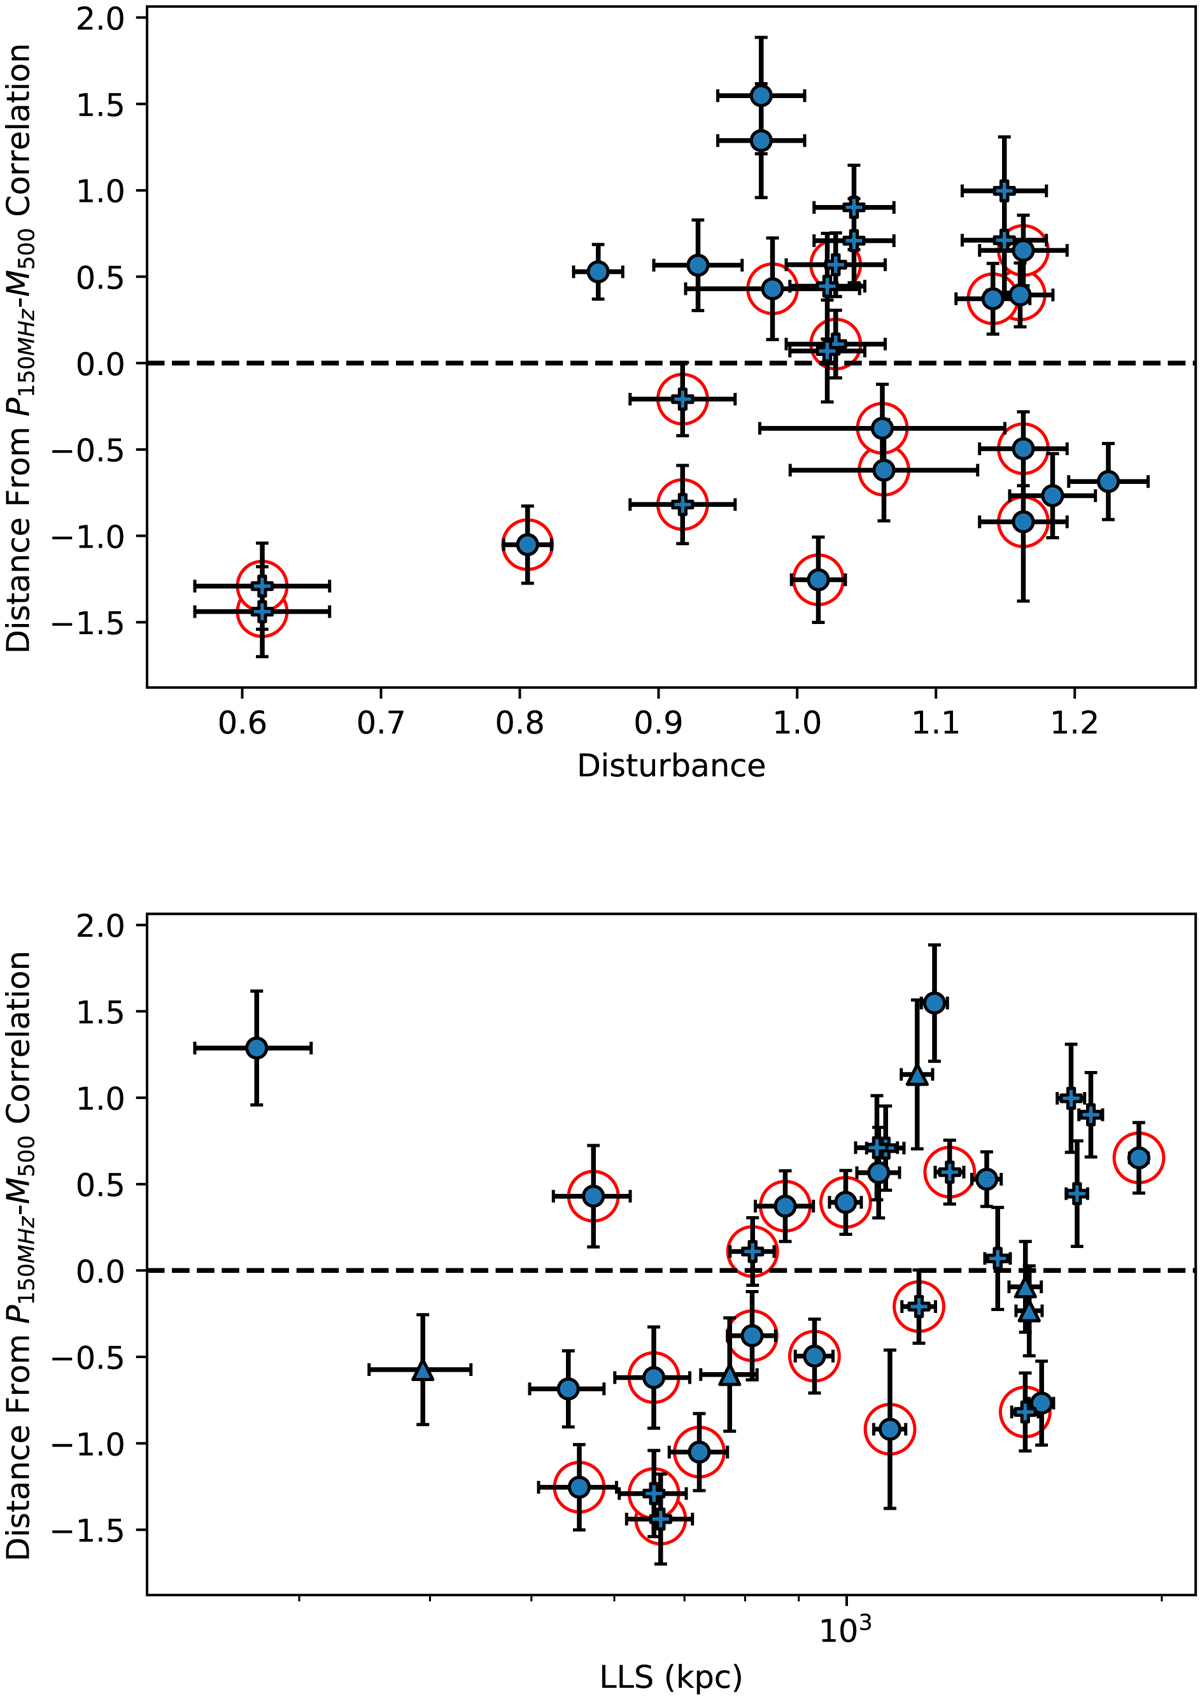
Logarithmic distance from P–M correlation (along P150 MHz axis, Fig. 6) vs. LLS (top), disturbance (bottom). The distance is calculated from the orthogonal fit on all relics (except PSZ2 G069.39+68.05, PSZ2 G107.10+65.32; see Table 2). PSZ2 G069.39+68.05, PSZ2 G107.10+65.32 are excluded from the plots.
Current usage metrics show cumulative count of Article Views (full-text article views including HTML views, PDF and ePub downloads, according to the available data) and Abstracts Views on Vision4Press platform.
Data correspond to usage on the plateform after 2015. The current usage metrics is available 48-96 hours after online publication and is updated daily on week days.
Initial download of the metrics may take a while.