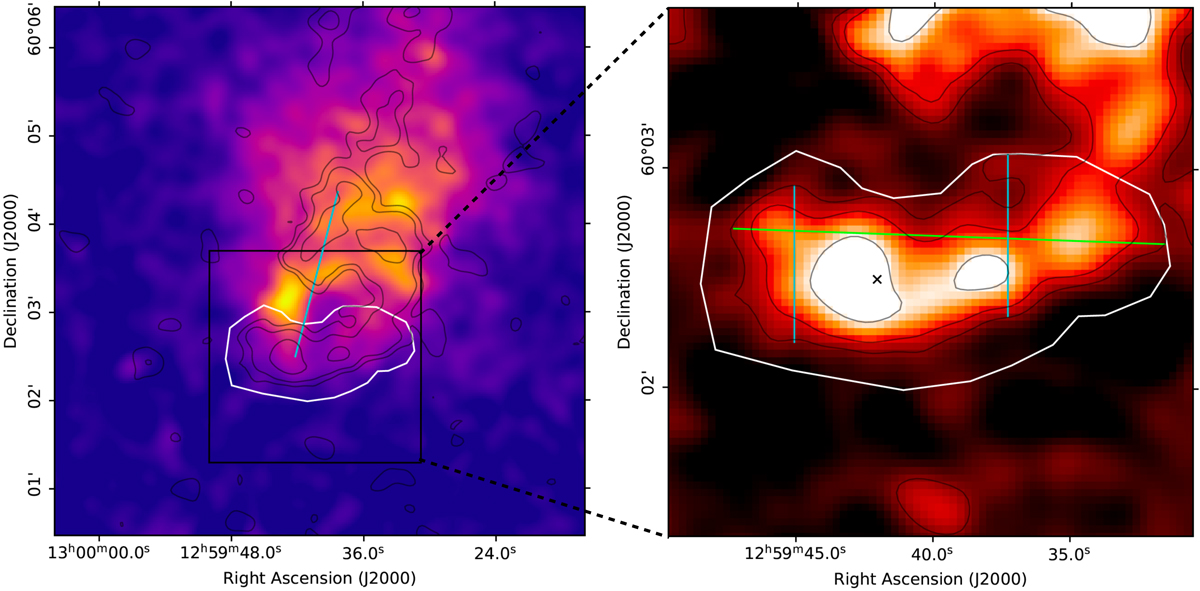
Fig. 2.
Download original image
Reference images of the relic in PSZ2 G121.03+57.02. The white region shows the region used to compute the properties of the relic. Black lines show the 2σrms × [1, 2, 4, …] contours from the 50 kpc-taper, compact-source-subtracted LOFAR image from Botteon et al. (2022). Left: Chandra X-ray image. The cyan line scales the distance between the relic position and the cluster centre, as defined in Sect. 2.2. Right: zoom-in of the 50-kpc-taper, compact-source-subtracted LOFAR, centred on the relic. The green line shows the LLS of the relic. Two example lines used to measure the relic width are shown in cyan. The black cross is where we define the relic coordinate.
Current usage metrics show cumulative count of Article Views (full-text article views including HTML views, PDF and ePub downloads, according to the available data) and Abstracts Views on Vision4Press platform.
Data correspond to usage on the plateform after 2015. The current usage metrics is available 48-96 hours after online publication and is updated daily on week days.
Initial download of the metrics may take a while.