Open Access
Fig. 3.
Download original image
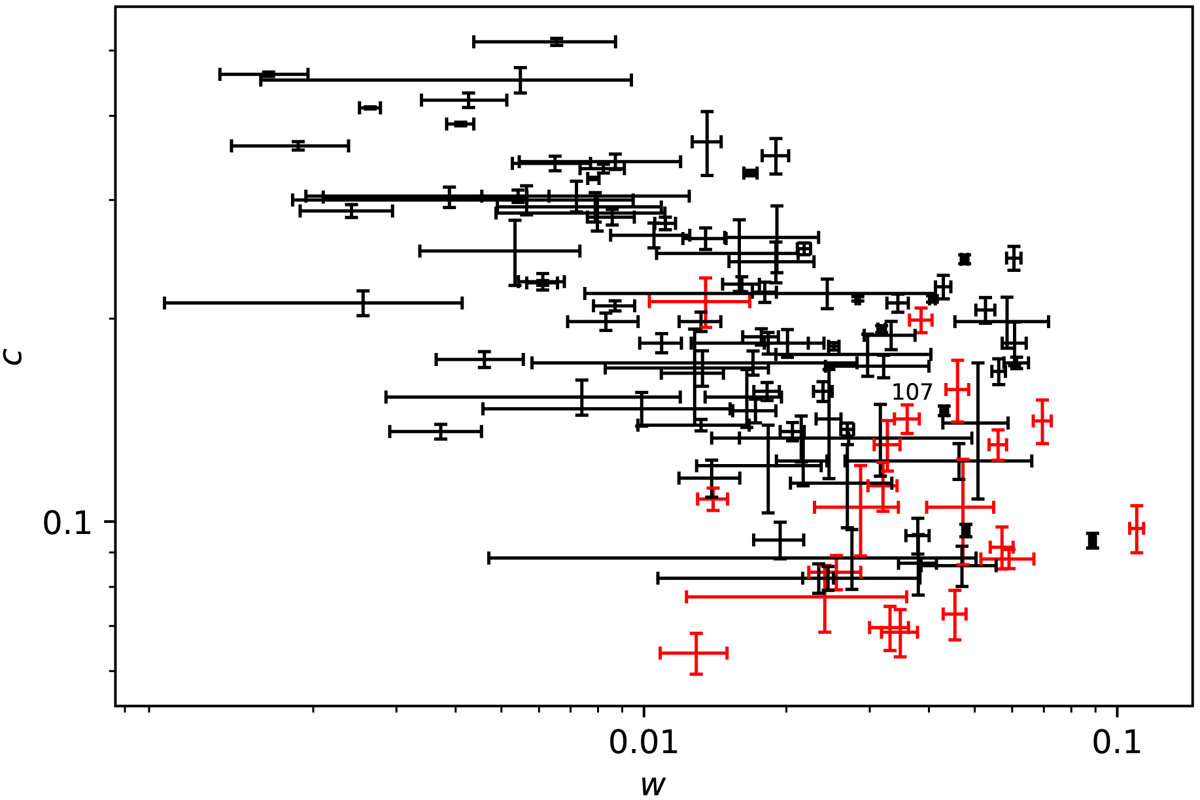
Concentration parameter, c vs. centroid shift, w for all clusters with X-ray observations above the Planck 50% completeness line in the DR2 sample. Relic-hosting clusters are denoted by red points. All other clusters are black. PSZ2 G107.10+65.32 is labelled, with the label directly above the data point.
Current usage metrics show cumulative count of Article Views (full-text article views including HTML views, PDF and ePub downloads, according to the available data) and Abstracts Views on Vision4Press platform.
Data correspond to usage on the plateform after 2015. The current usage metrics is available 48-96 hours after online publication and is updated daily on week days.
Initial download of the metrics may take a while.