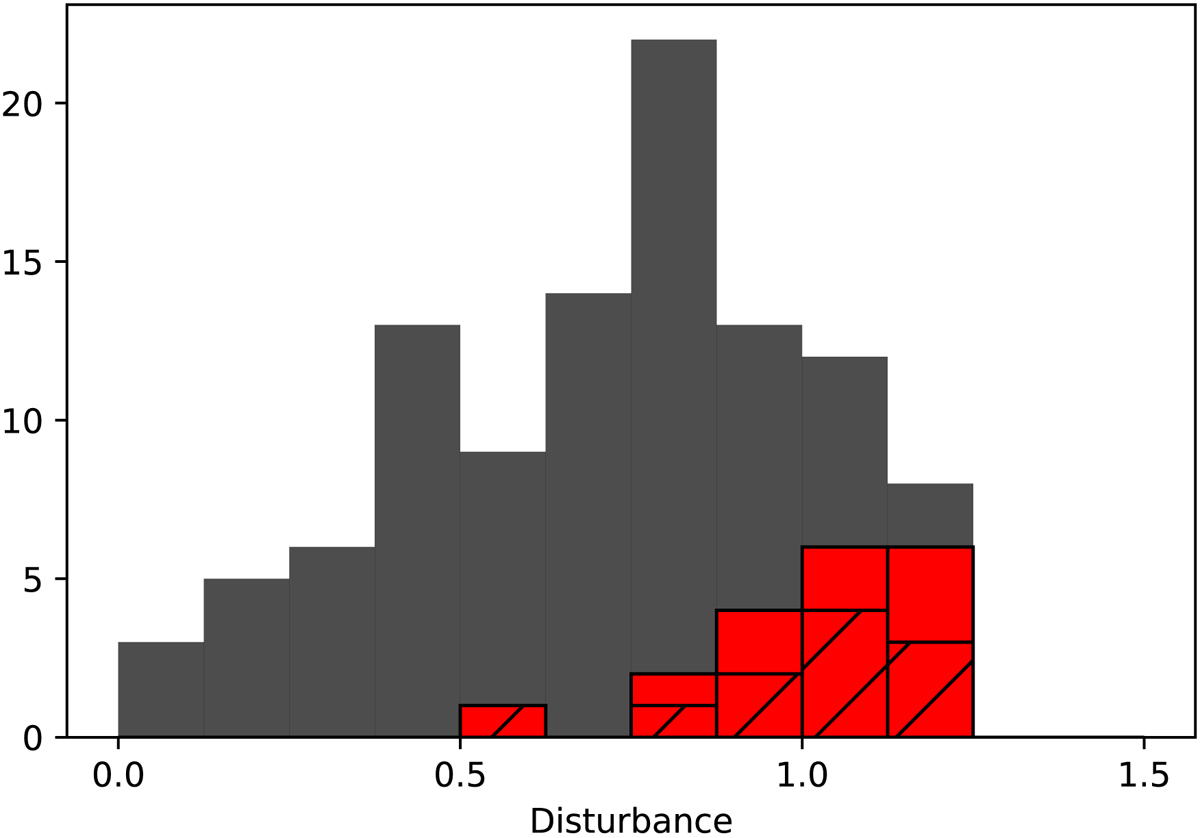
Fig. 4.
Download original image
Histogram of cluster disturbances. The grey bars show the distribution of all clusters above the Planck 50% completeness line in the LoTSS DR2 – PSZ2 sample with c and w measurements. The red bars show the distribution of all clusters which host a RR and the hatched bars show the clusters which host both a RR and RH. PSZ2 G107.10+65.32 is excluded entirely.
Current usage metrics show cumulative count of Article Views (full-text article views including HTML views, PDF and ePub downloads, according to the available data) and Abstracts Views on Vision4Press platform.
Data correspond to usage on the plateform after 2015. The current usage metrics is available 48-96 hours after online publication and is updated daily on week days.
Initial download of the metrics may take a while.