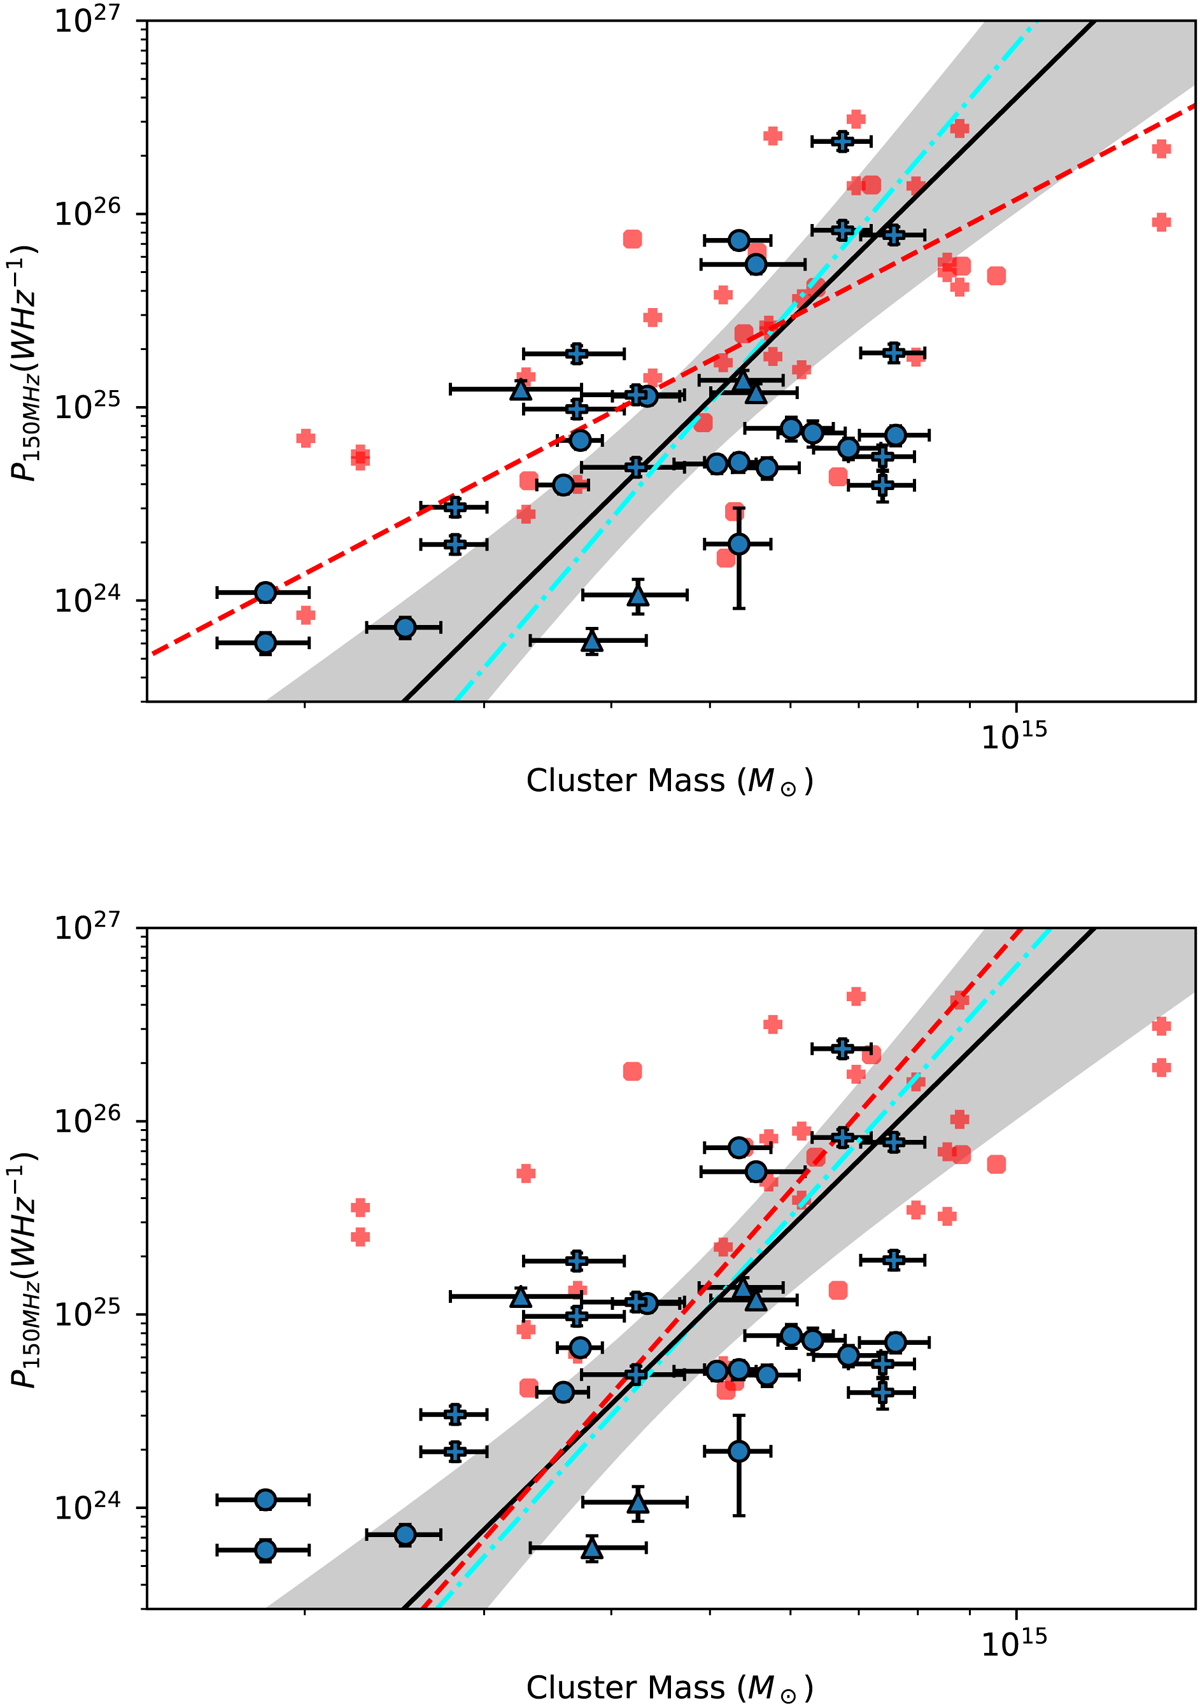
Fig. 6.
Download original image
Relic power vs. cluster mass with regression lines. Triangles denote candidate relics and plusses those relics which are part of a double relic pair. The black (solid) and cyan (dot-dash) lines are the orthogonal least squares regression lines for the relics in the DR2 sample. Black is if no candidate relics are included, with its corresponding confidence interval shaded, and cyan is if they are. Red points are the RRs from FdG14, with their corresponding regression line in red (orthogonal fit). Both PSZ2 G069.39+68.05 and PSZ2 G107.10+65.32 are excluded, since they are not used to calculate the regression lines. Top: FdG14 relic powers and regression line scaled to 150 MHz assuming α = −1 for all relics. We note that the cosmologies used to calculate powers are slightly different between this sample data and the FdG14 data. See Fig. B.1. Bottom: FdG14 powers scaled to 150 MHz using the actual spectral indices of each relic. Relics with no spectral information in FdG14 are excluded. The regression line (orthogonal fit) is recomputed on the scaled data.
Current usage metrics show cumulative count of Article Views (full-text article views including HTML views, PDF and ePub downloads, according to the available data) and Abstracts Views on Vision4Press platform.
Data correspond to usage on the plateform after 2015. The current usage metrics is available 48-96 hours after online publication and is updated daily on week days.
Initial download of the metrics may take a while.