Fig. 7.
Download original image
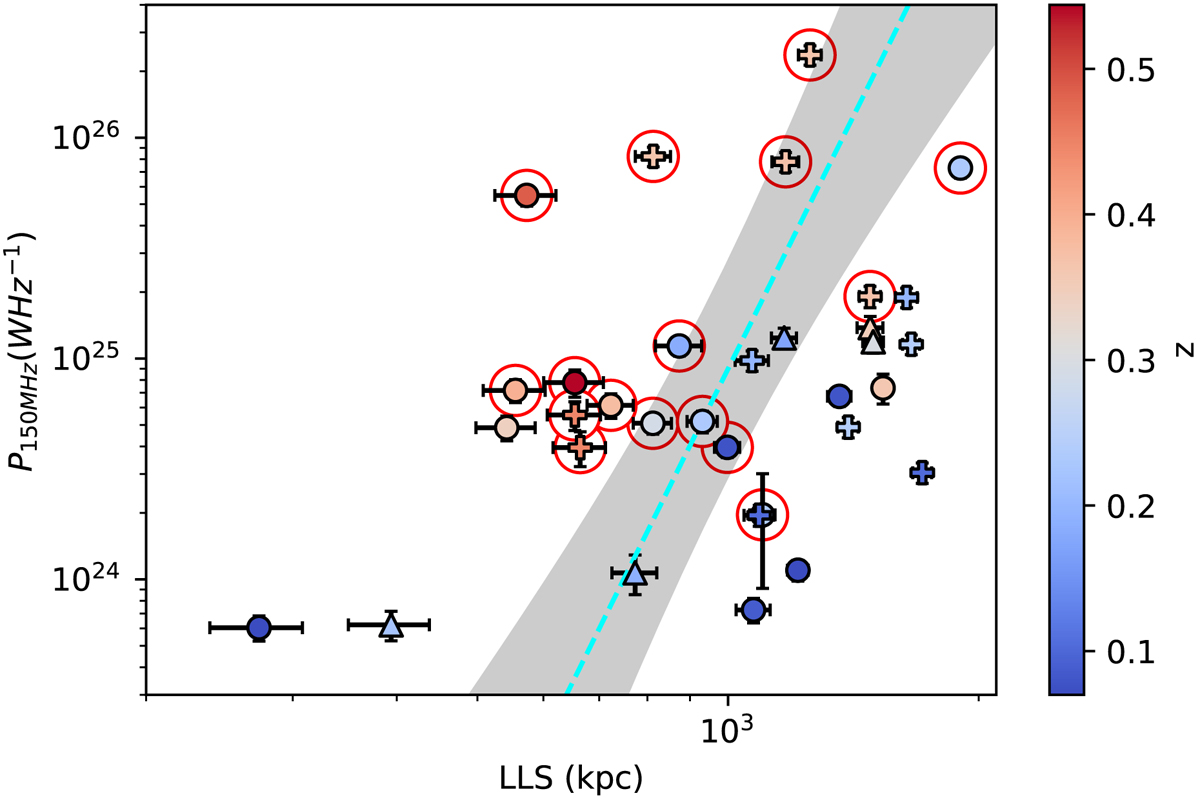
Radio relic power vs. LLS. The host cluster redshift is on the colour bar. Triangles denote candidate relics and plusses those relics which are part of a double relic pair. All other relics are plotted as circles. Red circles surround relics in clusters which also host a RH. The dotted cyan line is the regression line (orthogonal fit) for our sample, including cRRs, with its corresponding confidence interval shaded. We note that there is no line of best fit excluding cRRs, since the null hypothesis could not be rejected in this case. Both PSZ2 G069.39+68.05 and PSZ2 G107.10+65.32 are excluded.
Current usage metrics show cumulative count of Article Views (full-text article views including HTML views, PDF and ePub downloads, according to the available data) and Abstracts Views on Vision4Press platform.
Data correspond to usage on the plateform after 2015. The current usage metrics is available 48-96 hours after online publication and is updated daily on week days.
Initial download of the metrics may take a while.