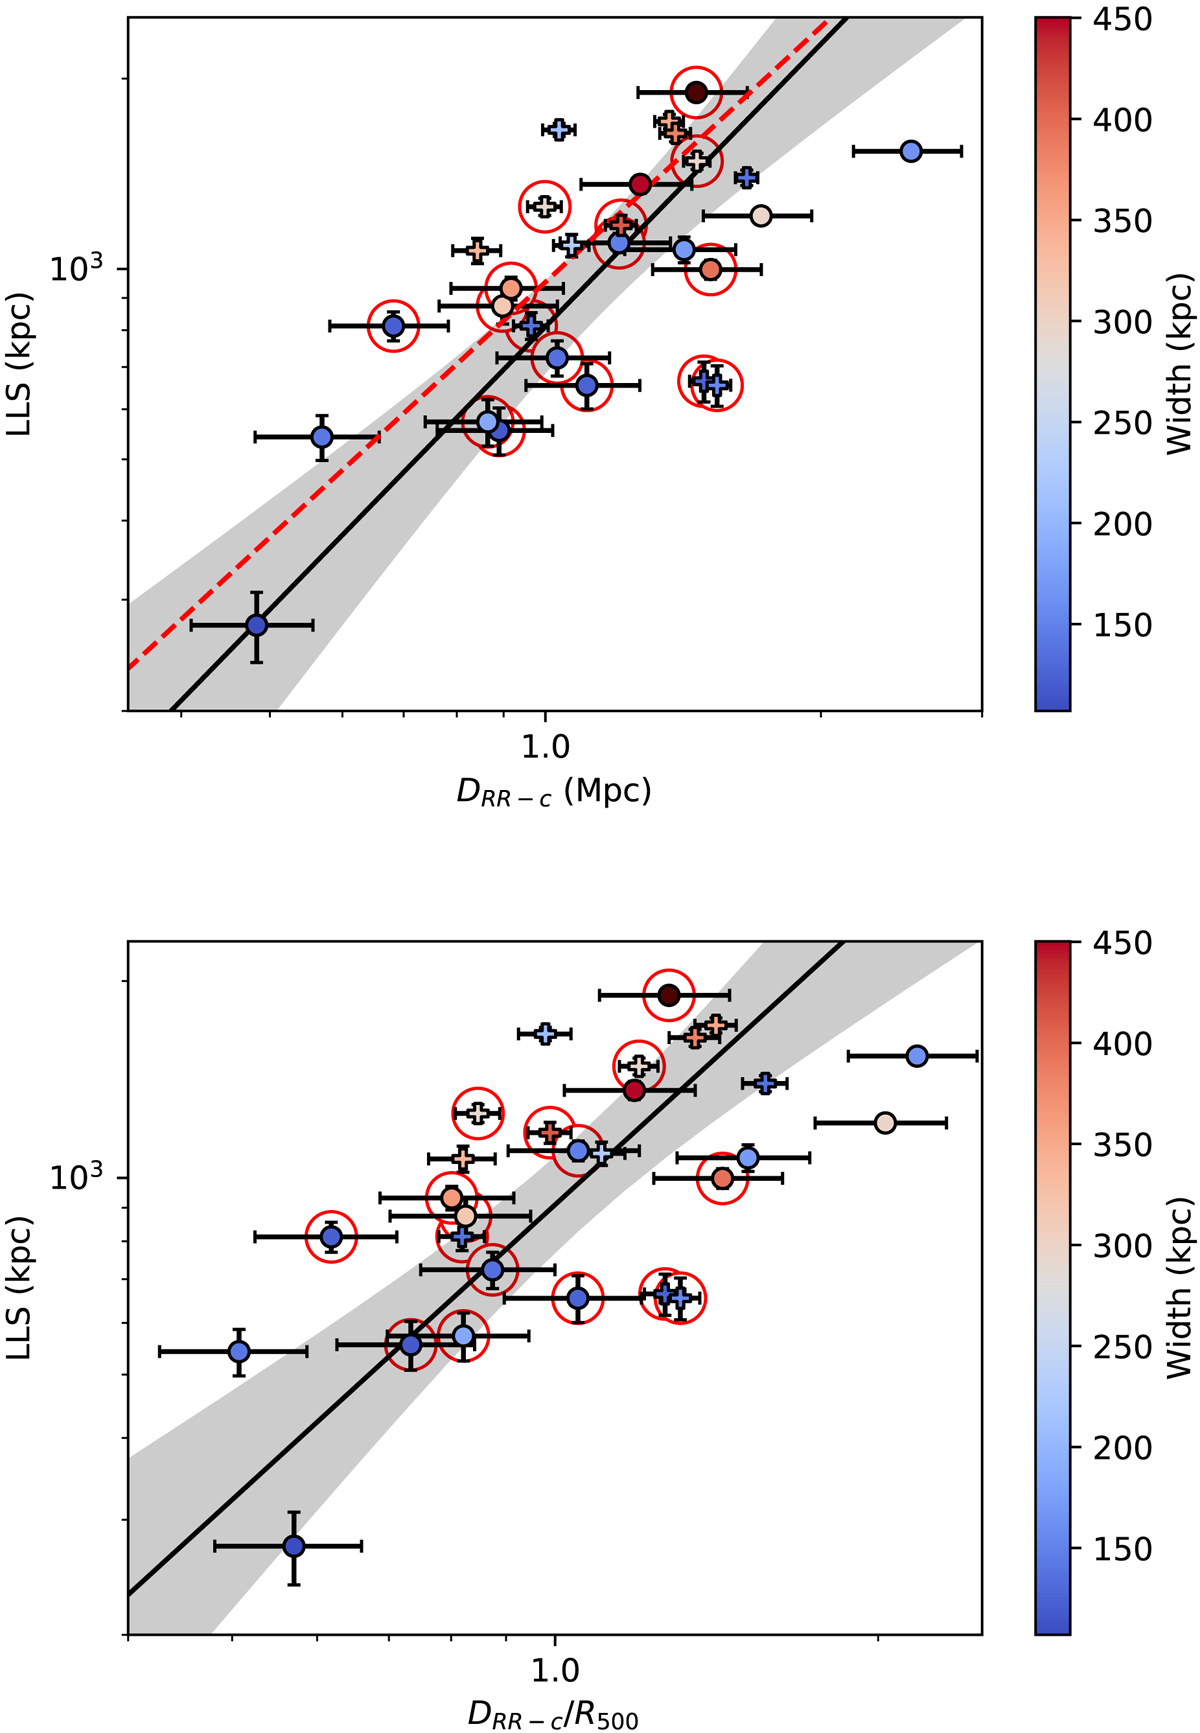
Fig. 8.
Download original image
Radio relic LLS as a function of its projected distance to the cluster centre. Top: LLS vs. cluster centre distance. The relic width is plotted on the colour bar. Plusses denote relics which are part of a double relic pair. All other relics are plotted as circles. Red circles surround relics in clusters which also host a RH. PSZ2 G107.10+65.32 is excluded. The black line is the regression line (orthogonal fit) for our sample, with its corresponding confidence interval shaded. The dashed red line is the regression line from FdG14. We note that there are no candidates, since the cluster centre is found from X-ray observations Bottom: same for the cluster centre distance as a fraction of the cluster R500. There is no corresponding FdG14 correlation against which to compare.
Current usage metrics show cumulative count of Article Views (full-text article views including HTML views, PDF and ePub downloads, according to the available data) and Abstracts Views on Vision4Press platform.
Data correspond to usage on the plateform after 2015. The current usage metrics is available 48-96 hours after online publication and is updated daily on week days.
Initial download of the metrics may take a while.