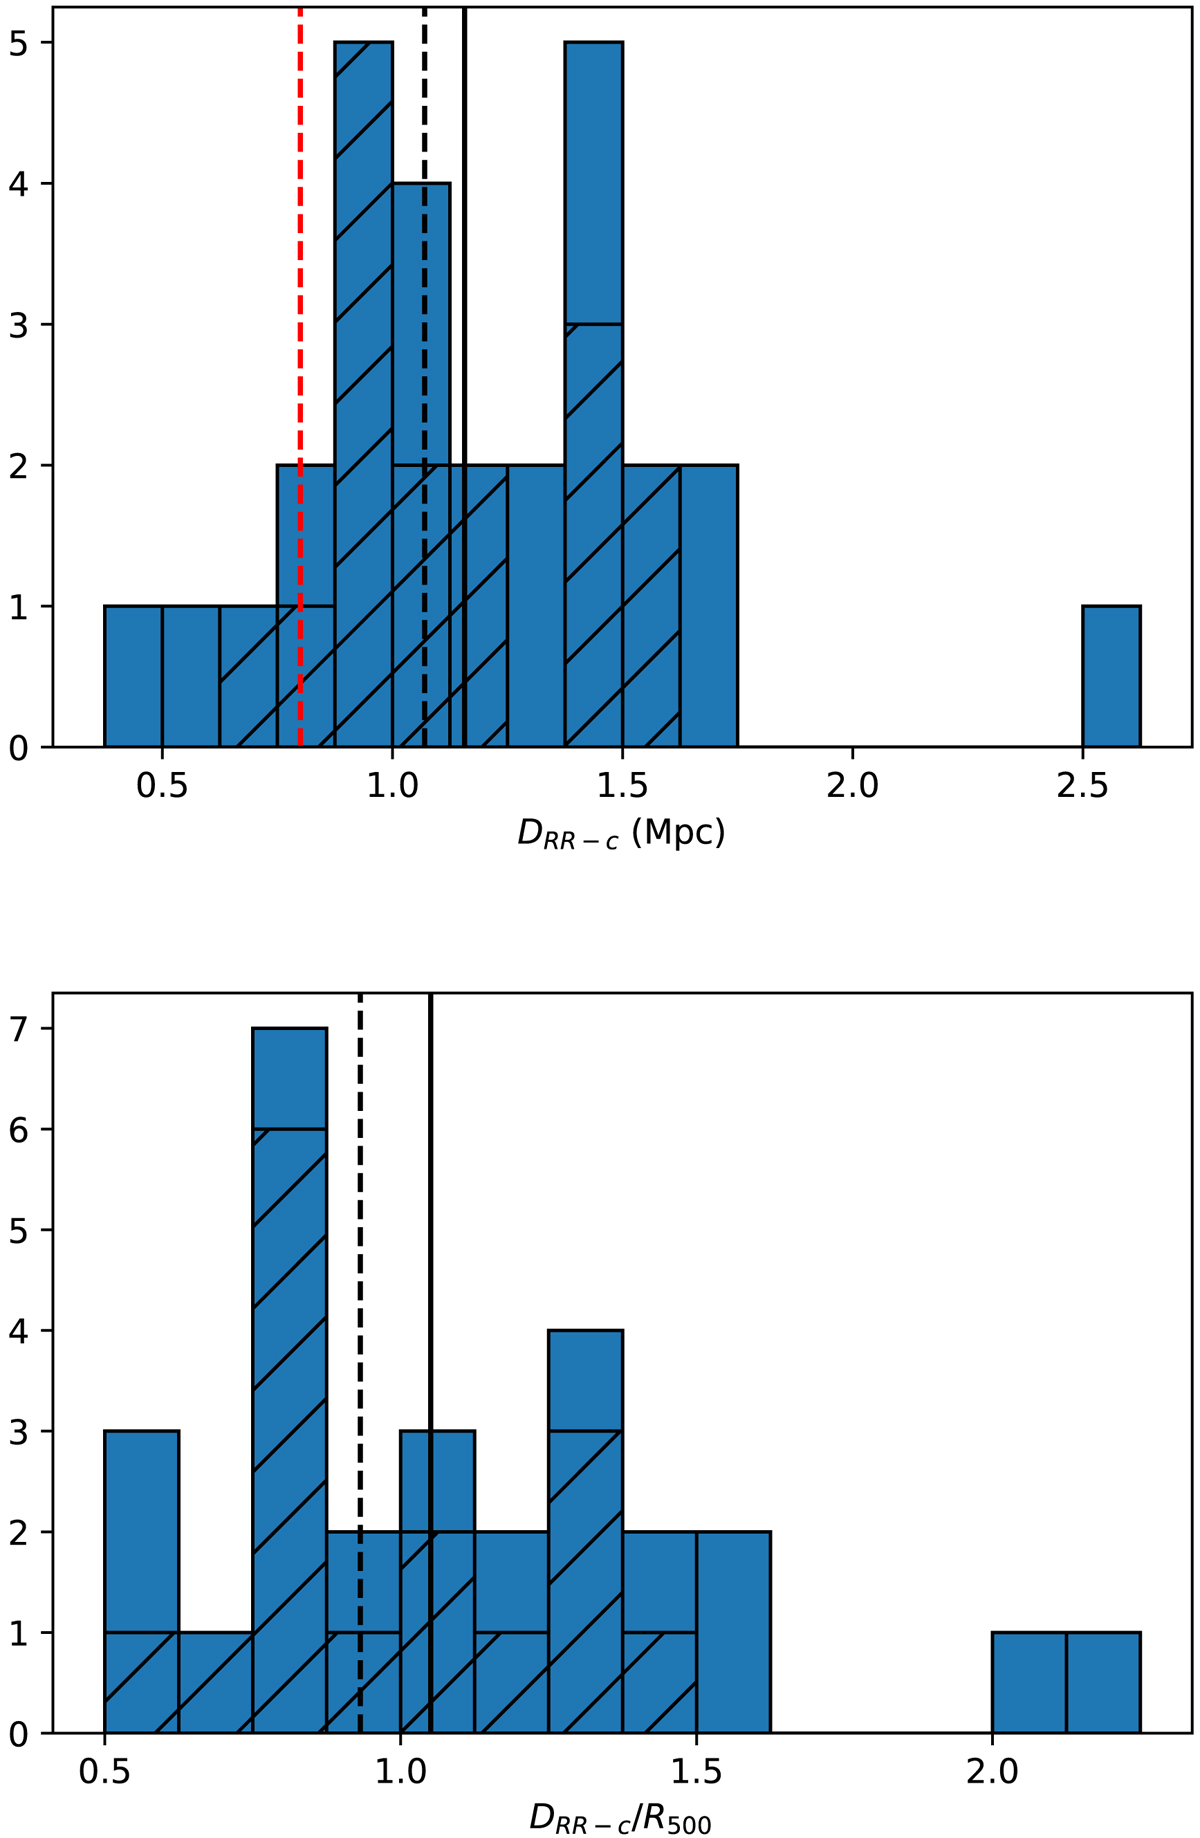
Fig. 9.
Download original image
Distribution of projected RR distances from their host-cluster centres. Top: histogram of the RR – cluster centre distances, DRR − c. The red dashed line is at 800 kpc. Bottom: histogram of the RR – cluster centre distances as a fraction of the cluster R500. The hatched bars in both plots show the distribution for only relics in RH-hosting clusters. The solid and dashed black lines correspond to the median distances for all relics and just those which also host a RH, respectively. We note that PSZ2 G107.10+65.32 is excluded for both histograms and the median calculations.
Current usage metrics show cumulative count of Article Views (full-text article views including HTML views, PDF and ePub downloads, according to the available data) and Abstracts Views on Vision4Press platform.
Data correspond to usage on the plateform after 2015. The current usage metrics is available 48-96 hours after online publication and is updated daily on week days.
Initial download of the metrics may take a while.