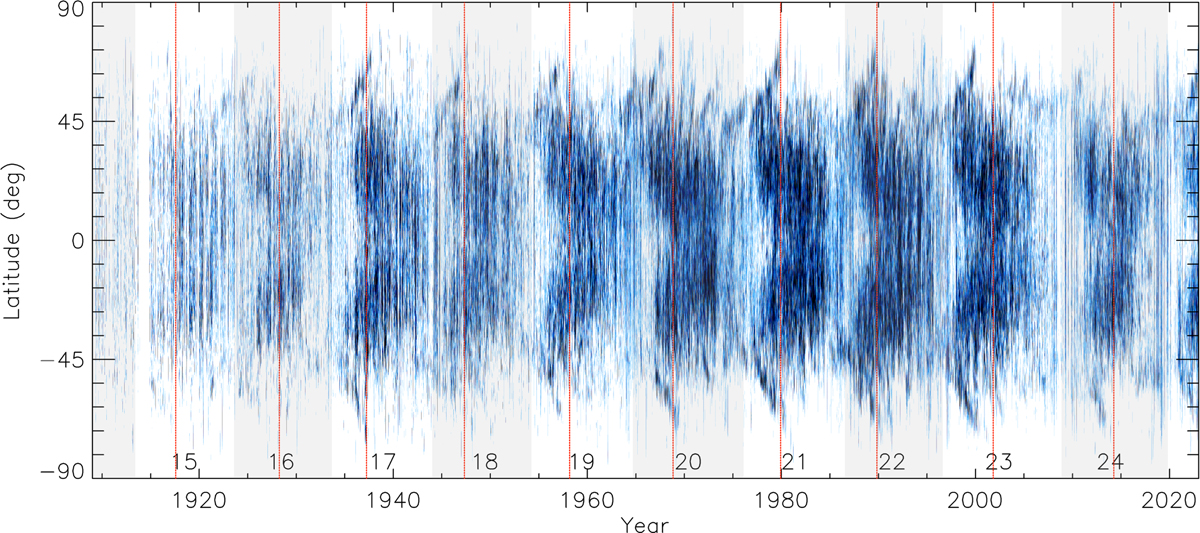
Fig. 13.
Download original image
Composite filament butterfly diagram constructed from the observations of all Hα archives, except for PM after 2014 and Ko after 1998 (see Sects. 2.1 and 3). The diagram shows daily mean areas within latitudinal strips of 1° as fractions of the area of the entire solar disc. White means no observed filaments, and blue denotes the filament fractional areas that become darker with growing areas up to the saturation level of 3 × 10⁻⁴. Even-numbered cycles are shaded in grey. The numbers in the lower part of the panel denote the conventional solar cycle numbering, and the date of the maximum of each cycle as defined by Sunspot Index and Long-term Solar Observations (SILSO, https://www.sidc.be/SILSO/cyclesminmax) is marked with a vertical red line.
Current usage metrics show cumulative count of Article Views (full-text article views including HTML views, PDF and ePub downloads, according to the available data) and Abstracts Views on Vision4Press platform.
Data correspond to usage on the plateform after 2015. The current usage metrics is available 48-96 hours after online publication and is updated daily on week days.
Initial download of the metrics may take a while.