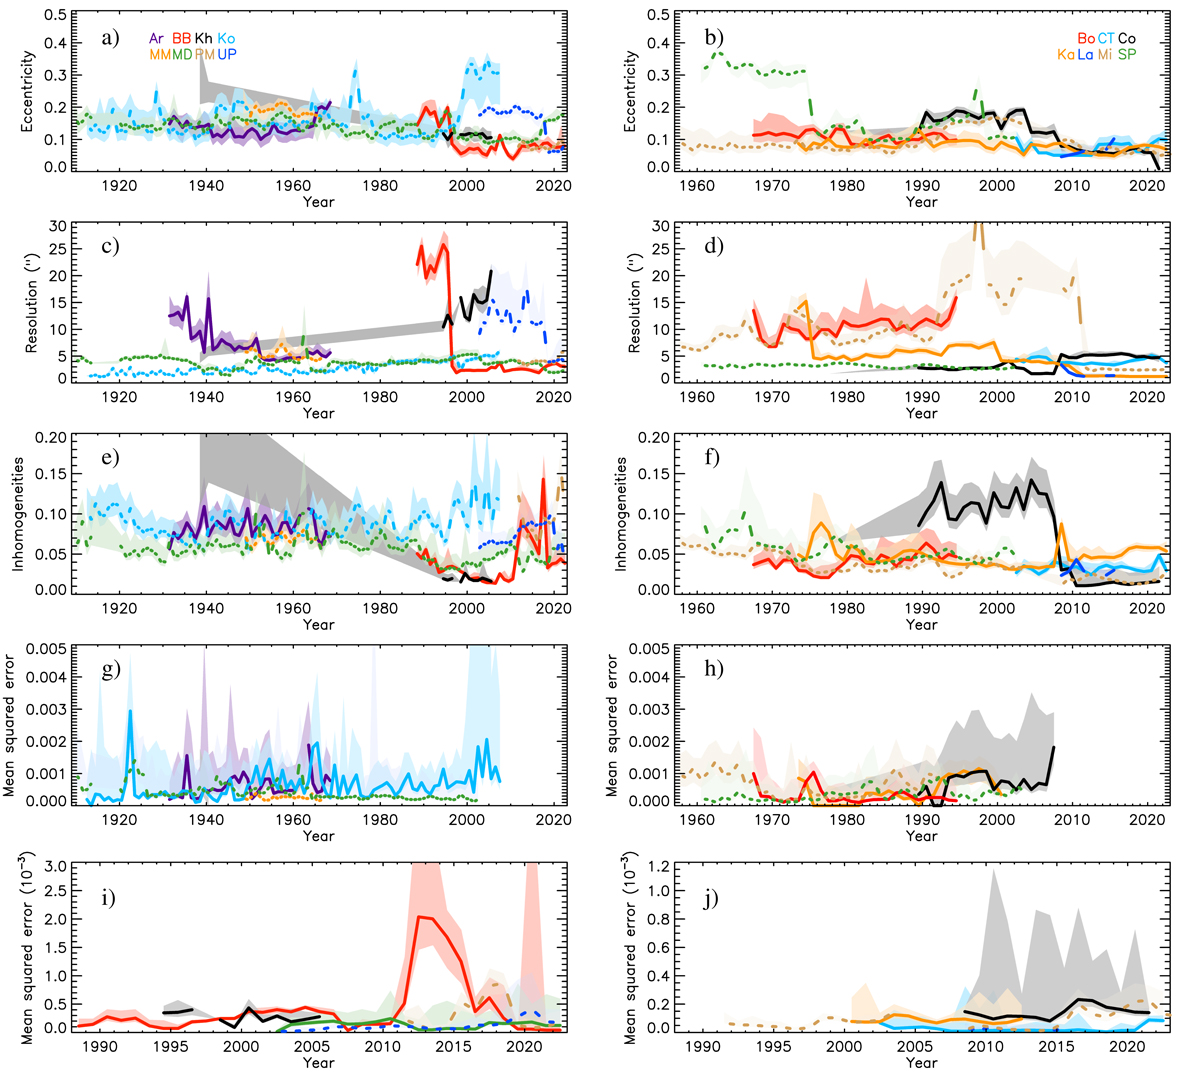
Fig. A.1.
Download original image
Temporal evolution of key characteristics of the raw Hα data. Panels a) and b): Eccentricity of the recorded solar disc. Panels c) and d): Spatial resolution. Panels e) and f): Large-scale inhomogeneities. Panels g)–j): Mean-squared error of the fit to the curve relating the measured QS CLV from the various archives to the reference QS CLV obtained from CT data. The latter is shown separately for the photographic data (panels g and h) and the CCD-based ones (panels i and j). The legend in the top panels gives the colour association of the different archives. We show annual median values, along with their asymmetric 1σ intervals (shaded surfaces; see Appendix A for more details).
Current usage metrics show cumulative count of Article Views (full-text article views including HTML views, PDF and ePub downloads, according to the available data) and Abstracts Views on Vision4Press platform.
Data correspond to usage on the plateform after 2015. The current usage metrics is available 48-96 hours after online publication and is updated daily on week days.
Initial download of the metrics may take a while.