Open Access
Fig. 2.
Download original image
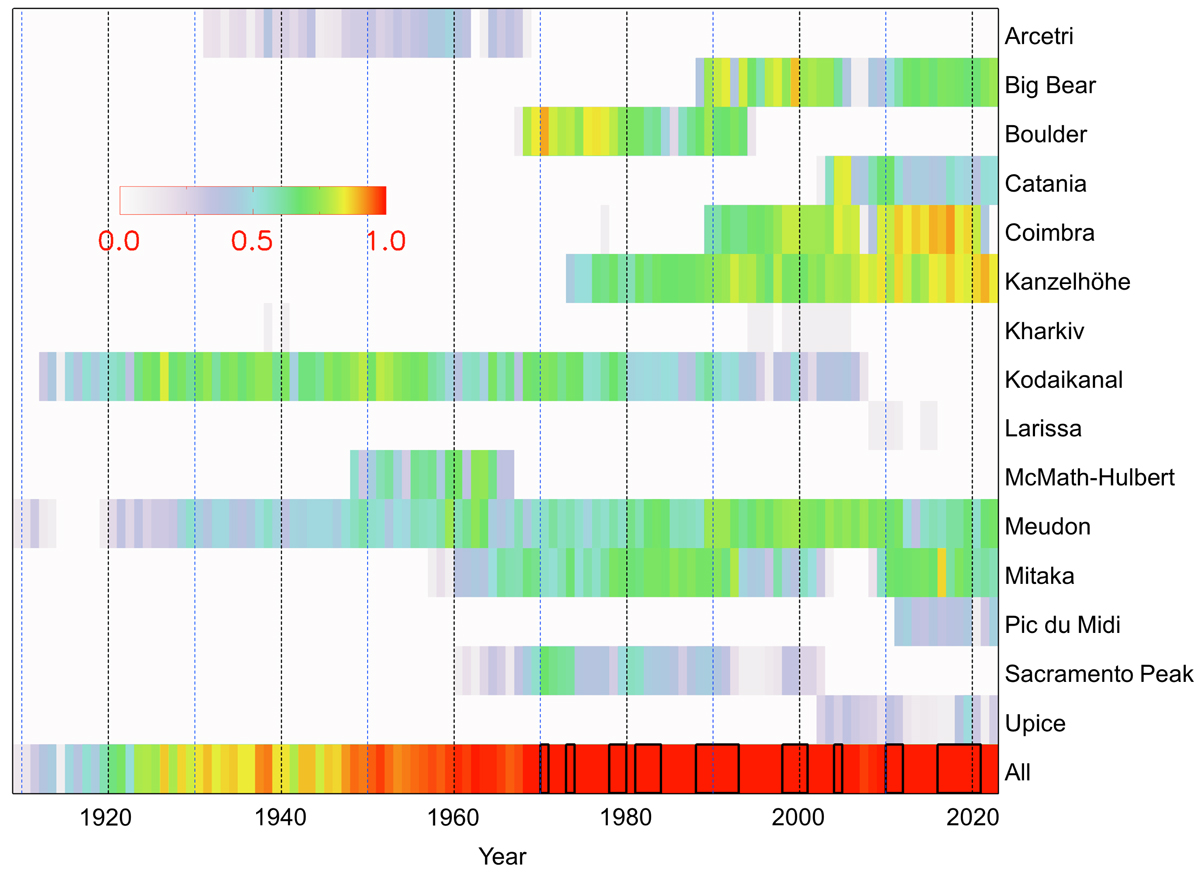
Annual fractional coverage by the various Hα archives analysed in this study. The annual coverage by all the archives combined is shown as well. The annual coverage is colour-coded as shown by the colour bar plotted within the plot. The black boxes mark the years with complete daily coverage.
Current usage metrics show cumulative count of Article Views (full-text article views including HTML views, PDF and ePub downloads, according to the available data) and Abstracts Views on Vision4Press platform.
Data correspond to usage on the plateform after 2015. The current usage metrics is available 48-96 hours after online publication and is updated daily on week days.
Initial download of the metrics may take a while.