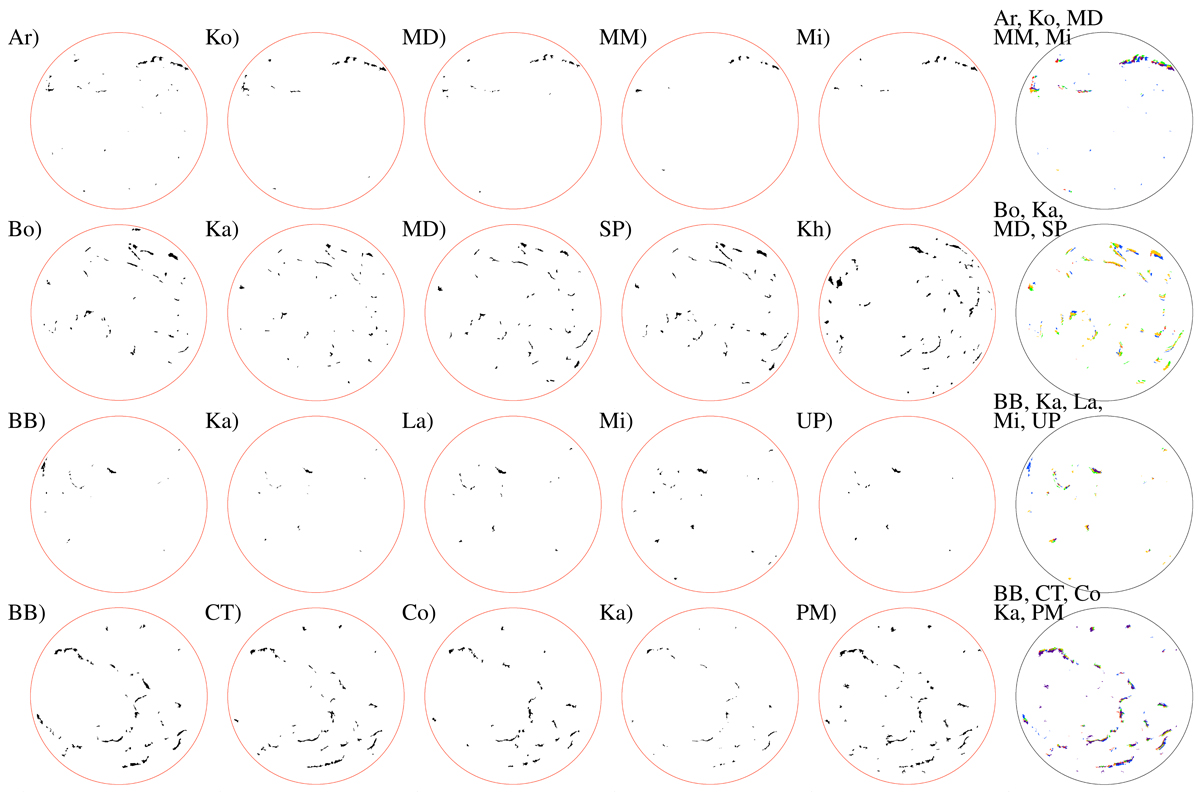
Fig. 4.
Download original image
Examples of masks identifying filaments in the observations shown in Fig. 1. The circles mark the disc boundaries, and filaments are shown in black. The last column is overlaid on the masks from the various observations taken on the same day and shown in the corresponding row in blue, red, green, yellow, and purple. The observations in each row were taken on the same day, with the exception of Kh in the second row, which is why it is not overlaid in the last panel of the row. In the masks shown in the last column, we have compensated for the differential rotation to show all of them as they would have been at 12:00 UTC.
Current usage metrics show cumulative count of Article Views (full-text article views including HTML views, PDF and ePub downloads, according to the available data) and Abstracts Views on Vision4Press platform.
Data correspond to usage on the plateform after 2015. The current usage metrics is available 48-96 hours after online publication and is updated daily on week days.
Initial download of the metrics may take a while.