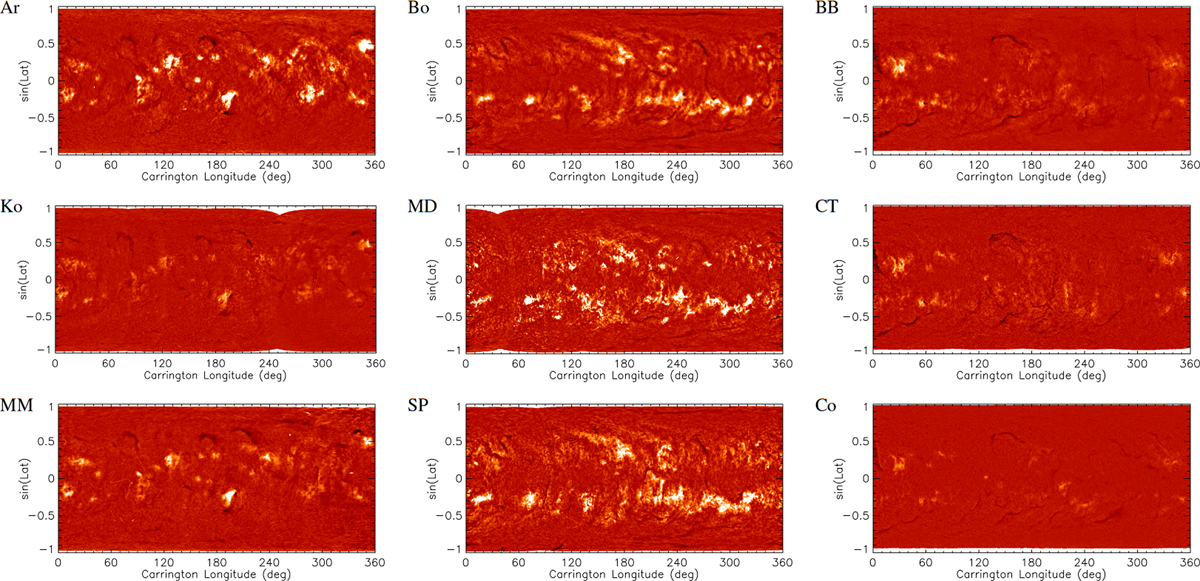
Fig. 5.
Download original image
Carrington maps constructed from the observations of nine Hα archives. Each column shows Carrington maps for the same rotations 1427 (7 May to 2 June 1960, left, see also the left column of Fig. 7), 1689 (30 November to 26 December 1979, middle), and 2141 (1 to 27 September 2013, right, see also the bottom row of Figs. 1–4). All maps show contrast values in the range [−0.5, 0.5].
Current usage metrics show cumulative count of Article Views (full-text article views including HTML views, PDF and ePub downloads, according to the available data) and Abstracts Views on Vision4Press platform.
Data correspond to usage on the plateform after 2015. The current usage metrics is available 48-96 hours after online publication and is updated daily on week days.
Initial download of the metrics may take a while.