Fig. 7.
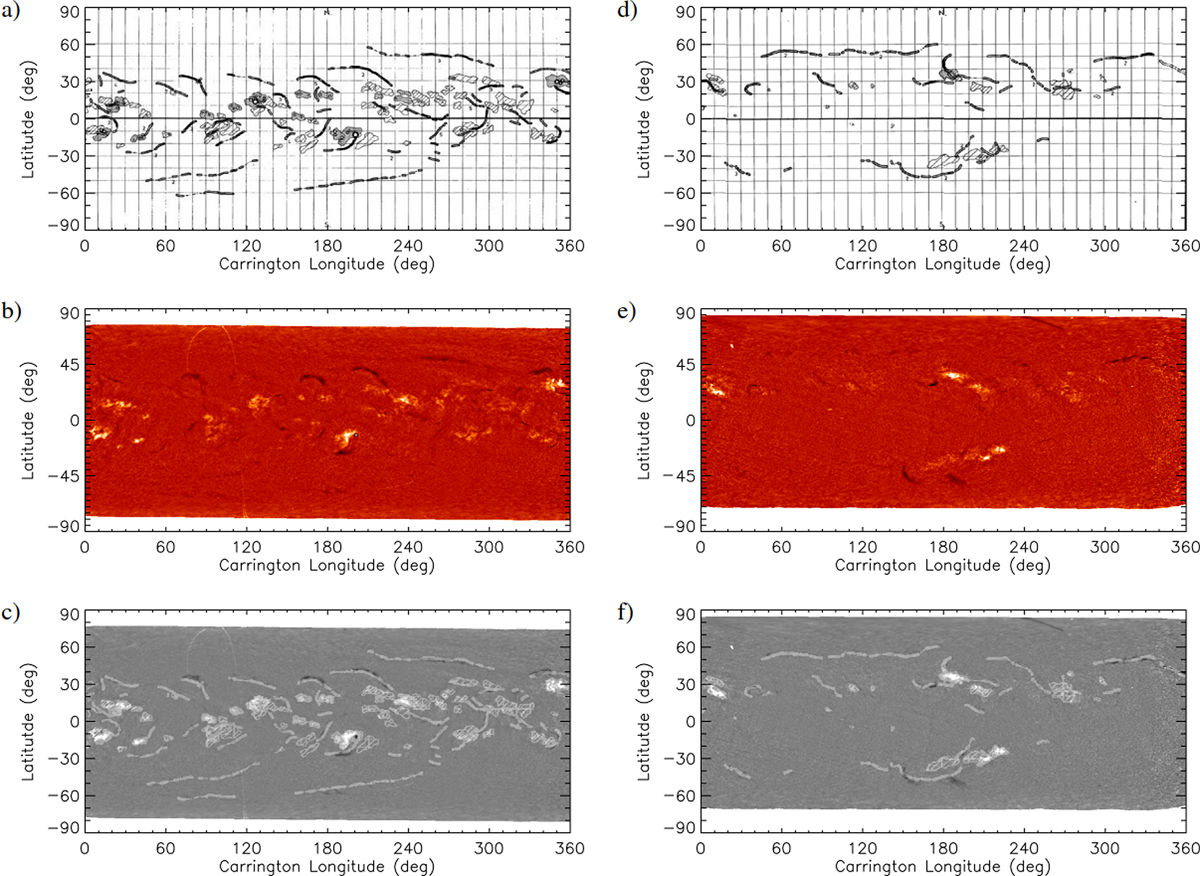
Download original image
Comparison of MD Hα maps for Carrington rotations 1427 (7 May to 2 June 1960, left, see also the middle column of Fig. 5) and 1497 (29 July to 25 August 1965, right, see also the top row of Figs. 1, 3 and 4 and right column of Fig. 6) produced manually by observations at Meudon (top row) and processed in this study (middle row). The bottom row shows the map obtained by overlapping the two corresponding maps shown in the upper two rows. To help visibility, this map is shown in greyscale, and the filaments from the manual processing (top panel) are shown in light grey instead of black.
Current usage metrics show cumulative count of Article Views (full-text article views including HTML views, PDF and ePub downloads, according to the available data) and Abstracts Views on Vision4Press platform.
Data correspond to usage on the plateform after 2015. The current usage metrics is available 48-96 hours after online publication and is updated daily on week days.
Initial download of the metrics may take a while.