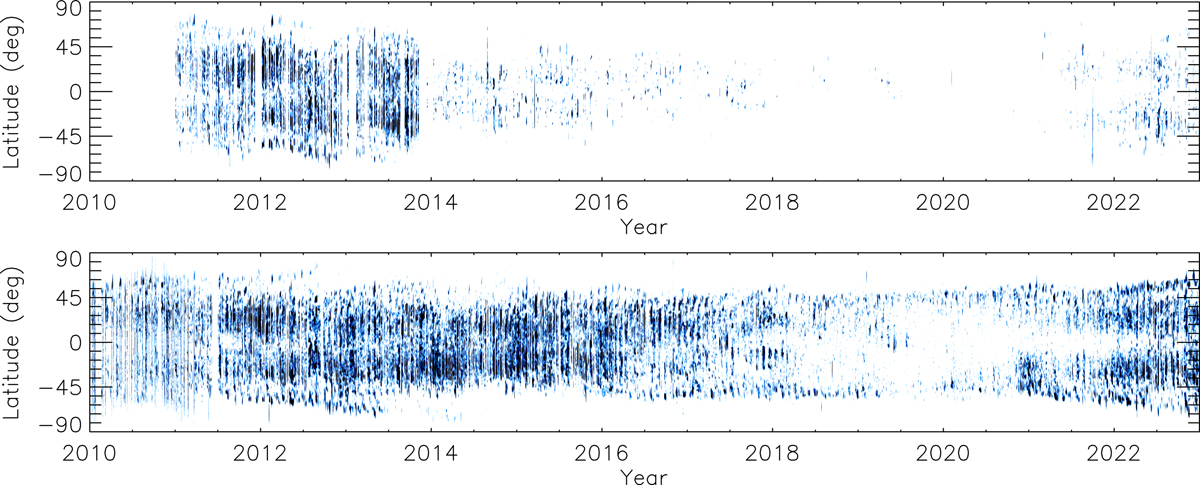
Fig. 9.
Download original image
Filament butterfly diagrams constructed from the observations of PM (top) Hα archive compared to those from Mi (bottom). The diagrams show daily mean filament areas within latitudinal strips of 1° as fractions of the area of the entire solar disc. White means no observed filaments, and blue denotes the filament fractional areas that become darker with growing areas up to the saturation level of 2 × 10⁻⁴.
Current usage metrics show cumulative count of Article Views (full-text article views including HTML views, PDF and ePub downloads, according to the available data) and Abstracts Views on Vision4Press platform.
Data correspond to usage on the plateform after 2015. The current usage metrics is available 48-96 hours after online publication and is updated daily on week days.
Initial download of the metrics may take a while.