Fig. 6.
Download original image
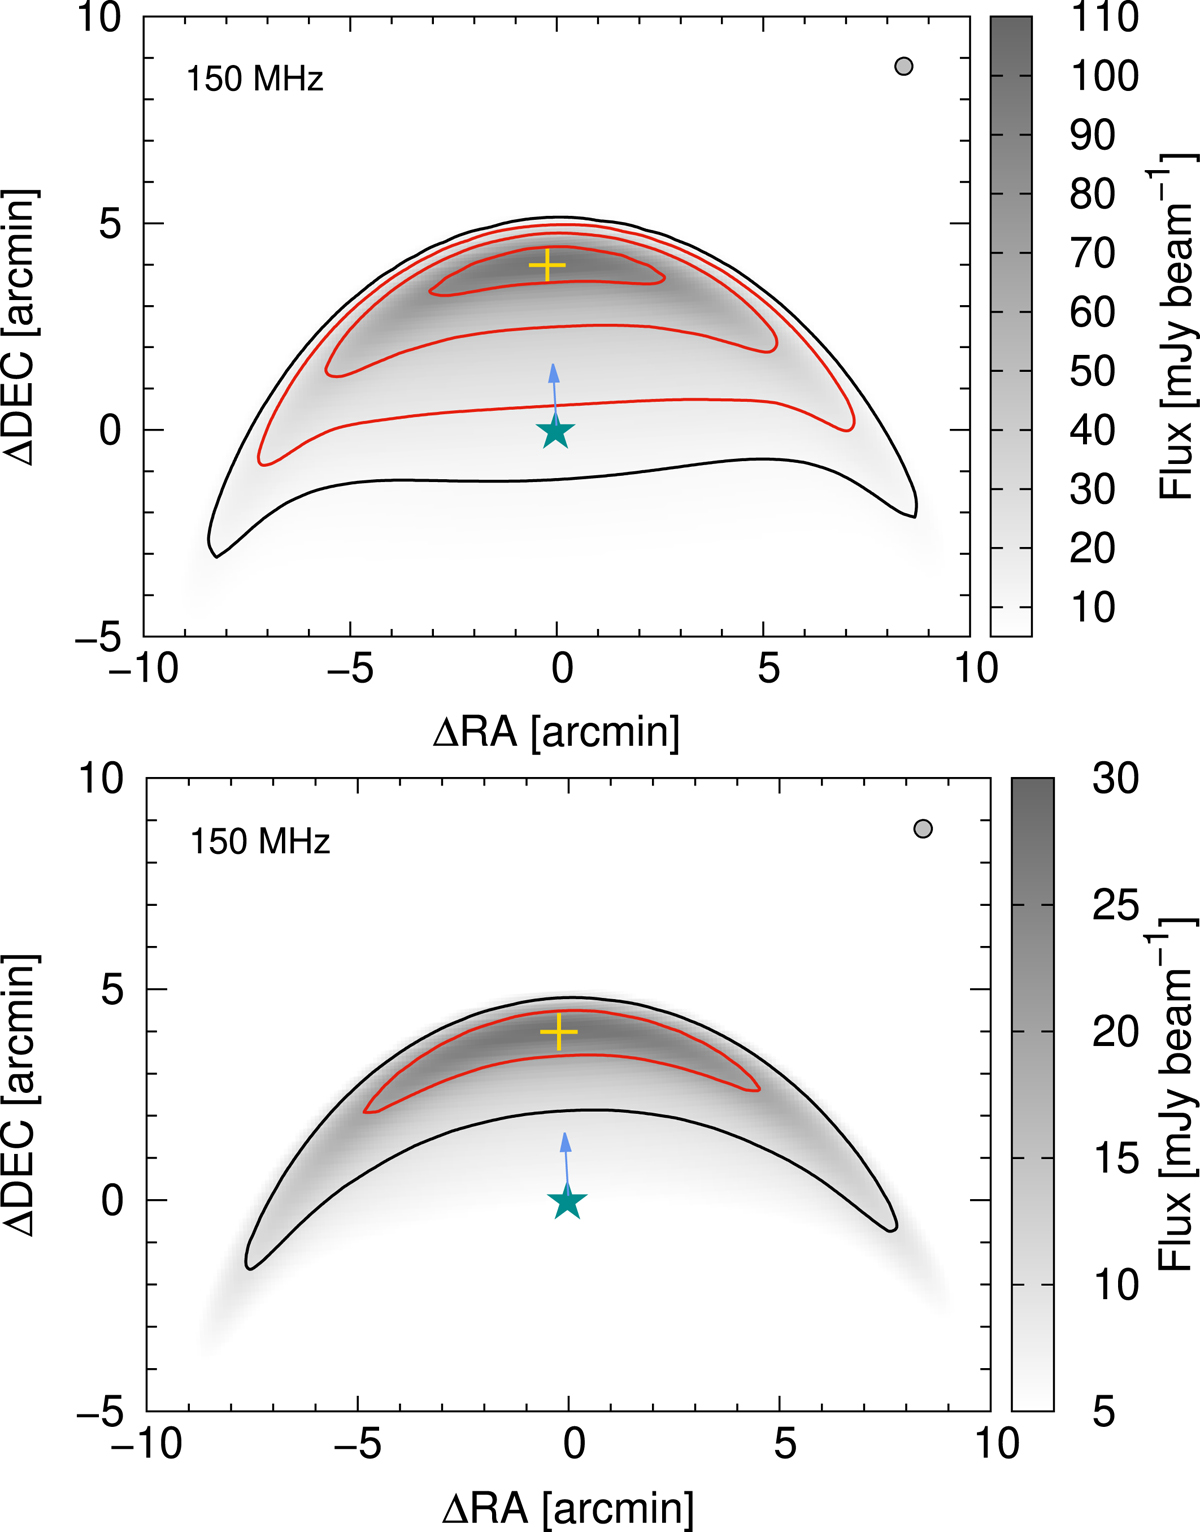
Simulated emission maps of the BS of BD+43°3654 at 150 MHz using the single index injection (top panel) and the piecewise injection (bottom panel). The beam size is 25″ × 25″. The black contour is 10 mJy beam−1 (similar to the rms of the map from the TGSS survey; see Fig. A.2), while the red contour levels are 20, 40, 80, and 120 mJy beam−1.
Current usage metrics show cumulative count of Article Views (full-text article views including HTML views, PDF and ePub downloads, according to the available data) and Abstracts Views on Vision4Press platform.
Data correspond to usage on the plateform after 2015. The current usage metrics is available 48-96 hours after online publication and is updated daily on week days.
Initial download of the metrics may take a while.