Fig. 8.
Download original image
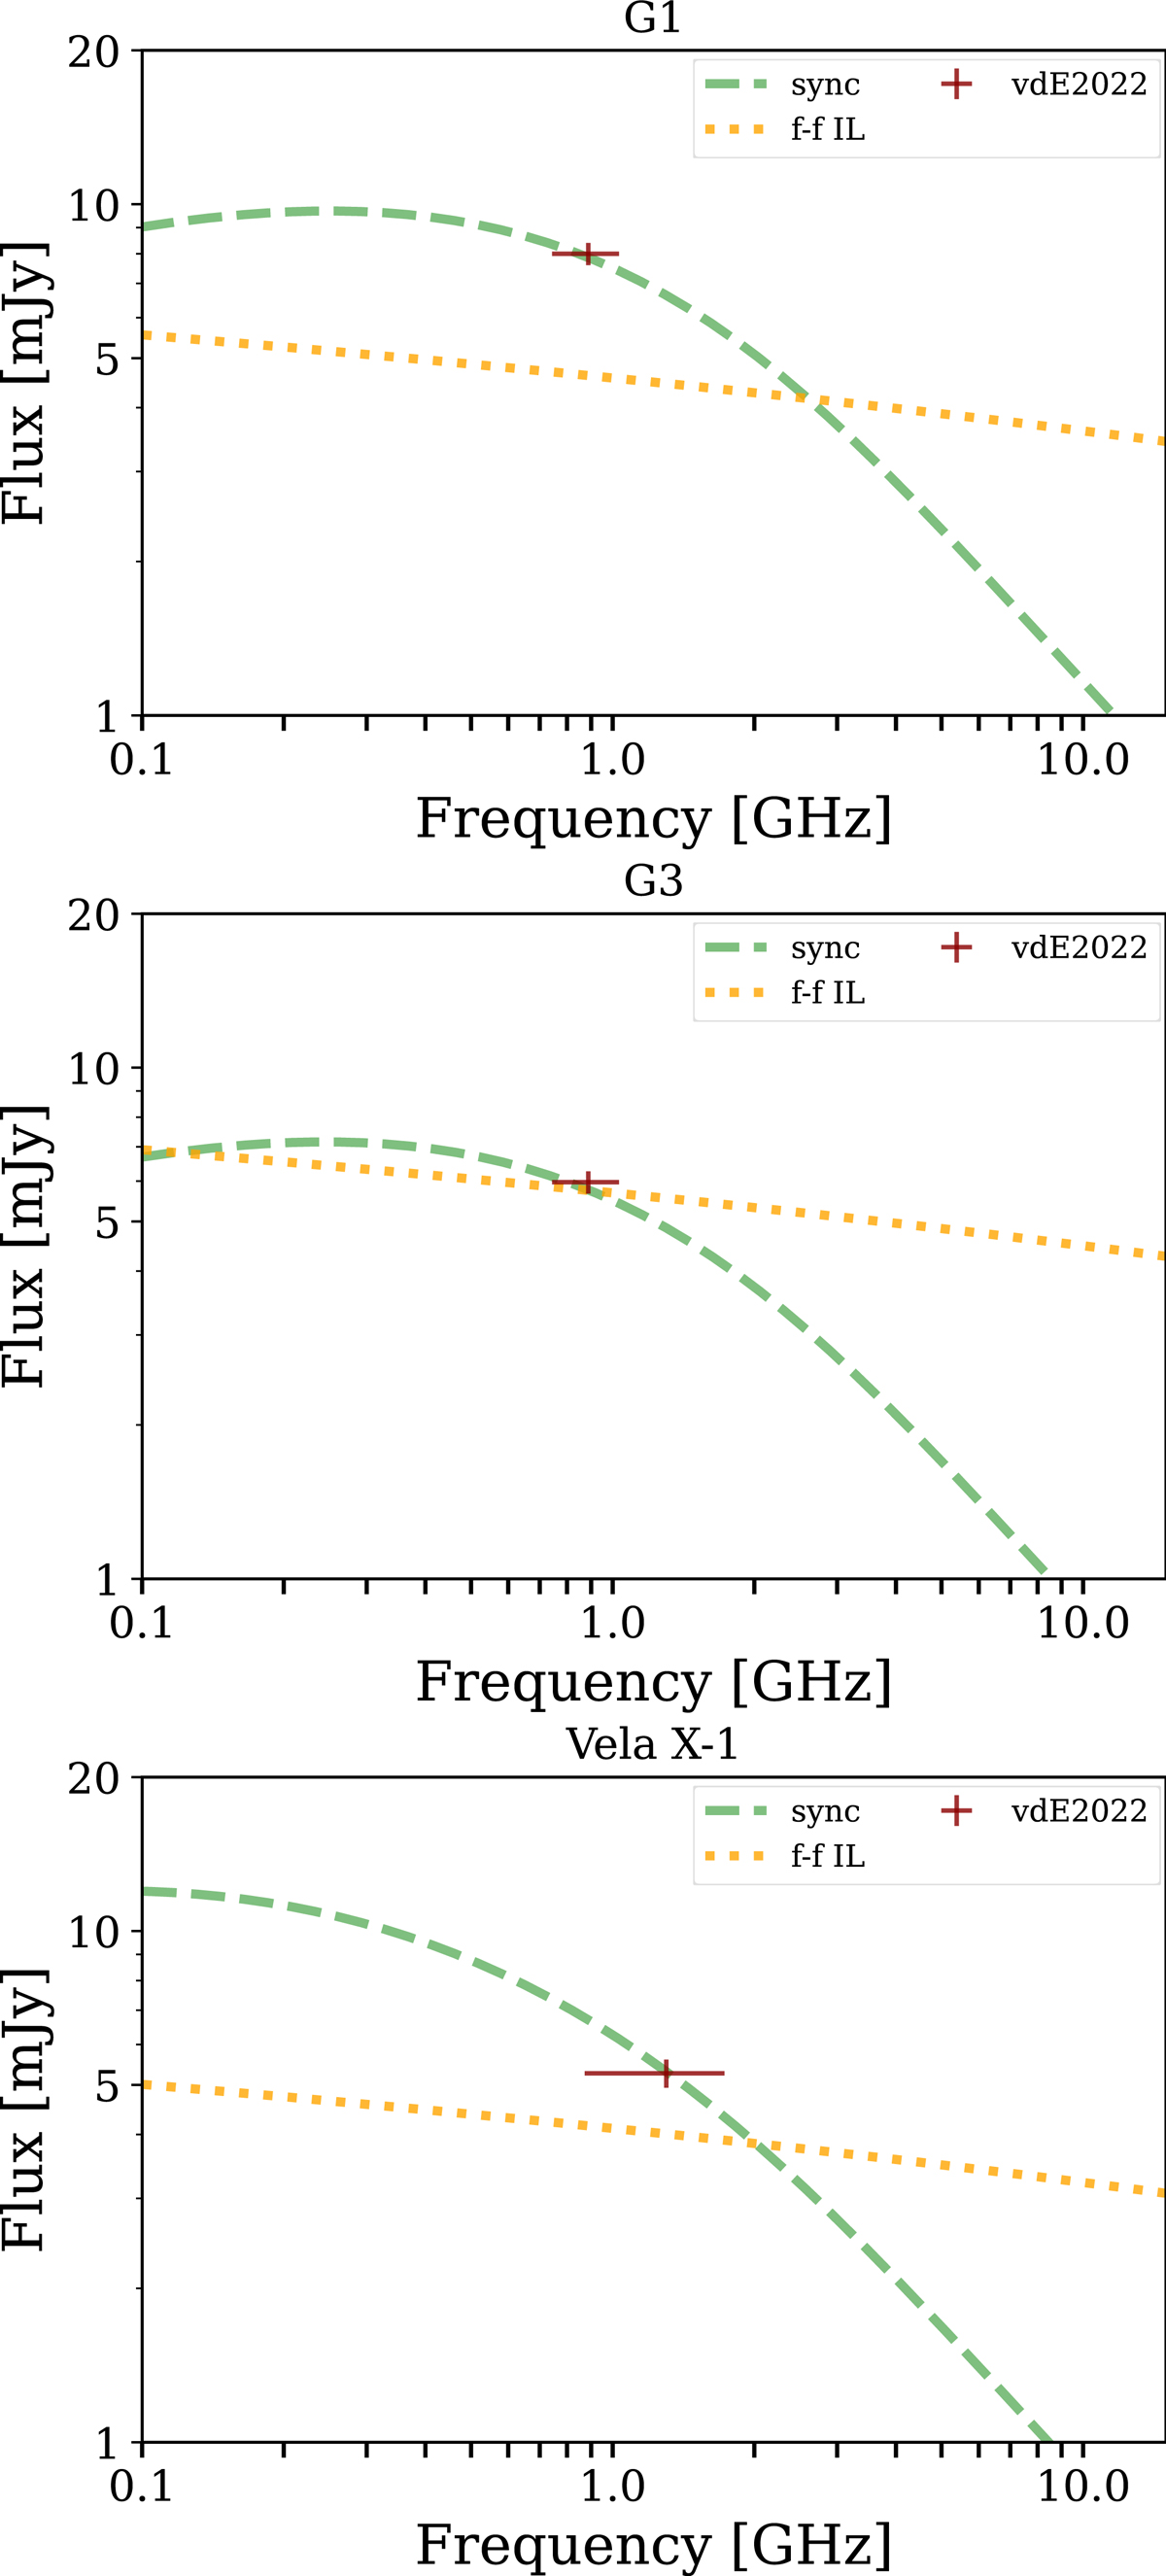
Modelled SEDs between 100 MHz and 15 GHz for G1 (top), G3 (middle), and Vela X-1 (bottom panel). In all cases, we consider two different scenarios: a NT one with a synchrotron spectrum (dashed green line) and a thermal one with free–free emission (dotted orange line). The red cross is the flux reported by van den Eijnden et al. (2022b) for G1 and G3, and by van den Eijnden et al. (2022a) for Vela X-1.
Current usage metrics show cumulative count of Article Views (full-text article views including HTML views, PDF and ePub downloads, according to the available data) and Abstracts Views on Vision4Press platform.
Data correspond to usage on the plateform after 2015. The current usage metrics is available 48-96 hours after online publication and is updated daily on week days.
Initial download of the metrics may take a while.