Fig. 14.
Download original image
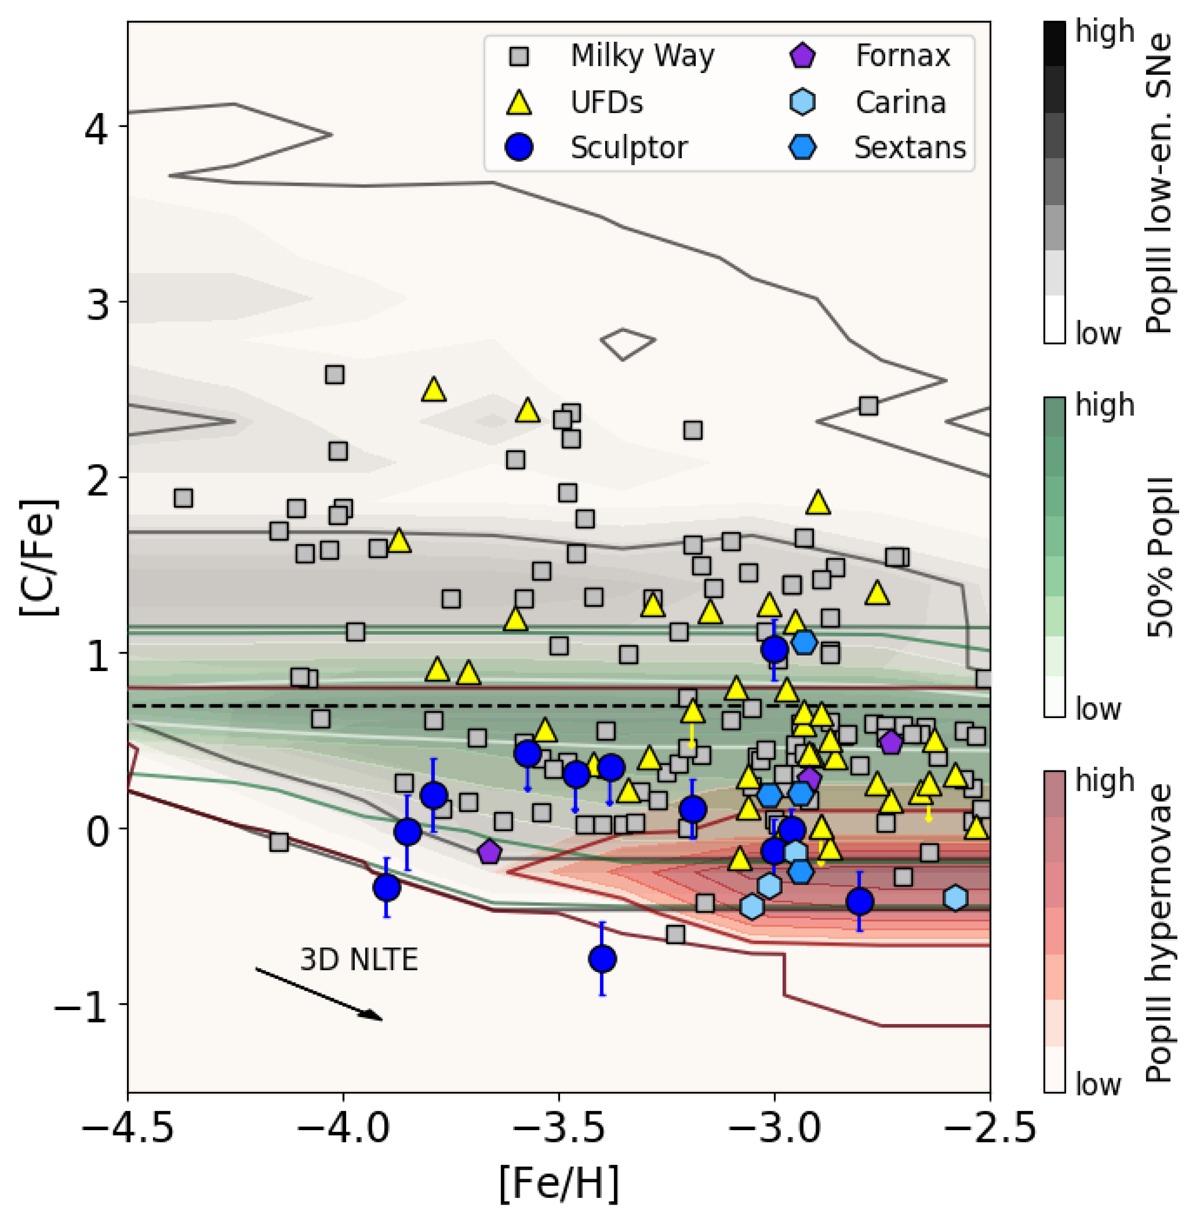
Density maps of the [C/Fe] with respect to [Fe/H] as predicted by our model for the descendants of Pop III stars (shaded areas) and measured abundances (LTE) of stars in Sculptor (blue circles), Sextans (medium-blue hexagons), Carina (light-blue hexagons), Fornax (purple pentagons), the UFDs (yellow triangles), and the Milky Way (grey squares). All measured [C/Fe] abundances have been corrected for internal mixing (Placco et al. 2014). The black arrow shows the expected size and direction of how measured stellar abundances are expected to change because of NLTE effects in [Fe/H]. The shaded areas are coloured depending on the type of stars that polluted the descendants: 100% of the Pop III low-energy SNe (grey, ESN < 1.5 × 1051 erg), 100% of the Pop III hypernovae (red, ESN > 5.0 × 1051 erg), 50% of the low-energy Pop III SNe, and 50% of the core-collapse Pop II SNe (green). The densest areas (and most probable abundances) are coloured with darker shades. In all cases, fmix = 0.063. References for the Milky Way and UFDs are listed in Sect. 5. The data of dSph galaxies are from Tafelmeyer et al. (2010), and from Lucchesi et al. (2020, 2023).
Current usage metrics show cumulative count of Article Views (full-text article views including HTML views, PDF and ePub downloads, according to the available data) and Abstracts Views on Vision4Press platform.
Data correspond to usage on the plateform after 2015. The current usage metrics is available 48-96 hours after online publication and is updated daily on week days.
Initial download of the metrics may take a while.