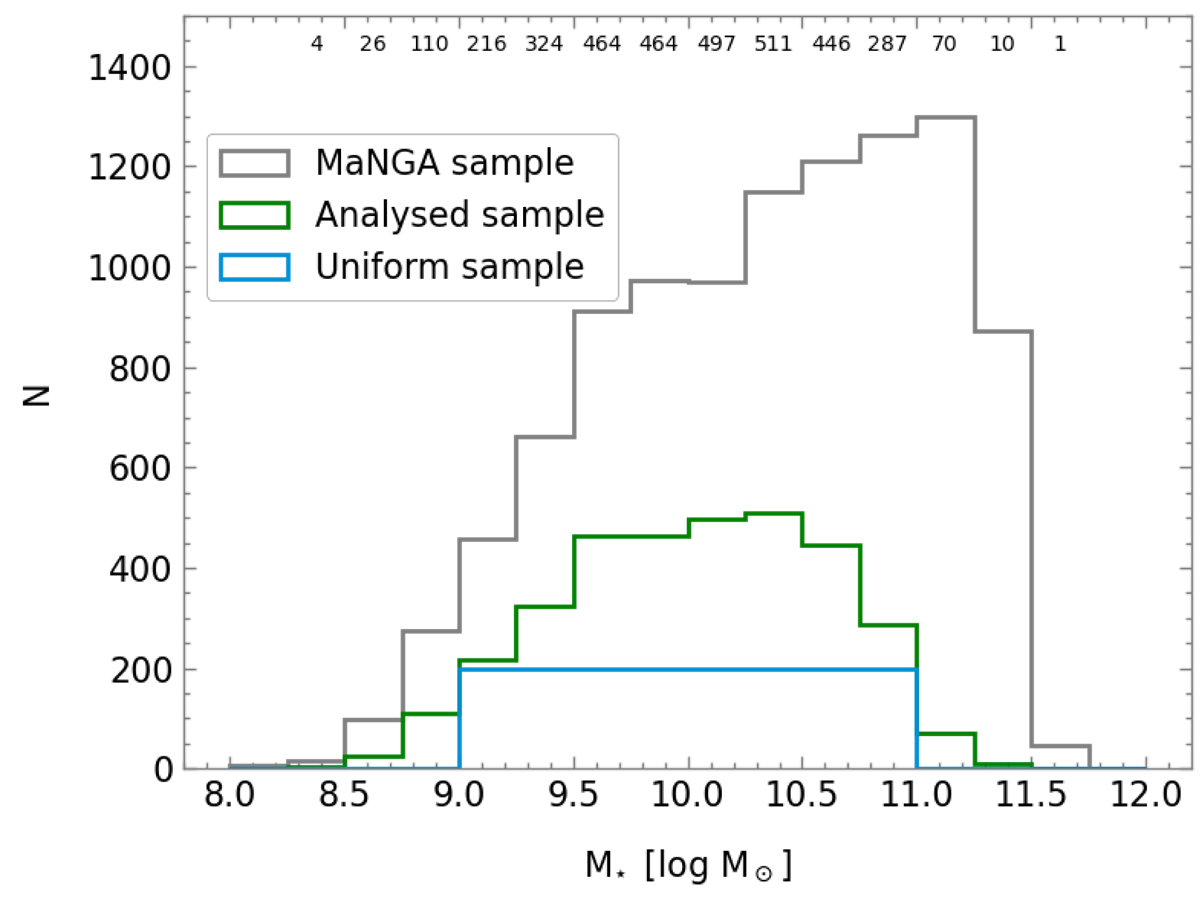
Fig. C.1.
Download original image
Stellar mass distribution of the galaxies analysed in this work (green) in comparison with the distribution of the subsample selected for this test (blue), characterised by a uniform distribution for the stellar mass. The numbers represented at the top indicate the number of galaxies from the original sample comprising each mass bin of 0.25 log(M⊙). The MaNGA mother sample is also shown in grey.
Current usage metrics show cumulative count of Article Views (full-text article views including HTML views, PDF and ePub downloads, according to the available data) and Abstracts Views on Vision4Press platform.
Data correspond to usage on the plateform after 2015. The current usage metrics is available 48-96 hours after online publication and is updated daily on week days.
Initial download of the metrics may take a while.