Fig. 2
Download original image
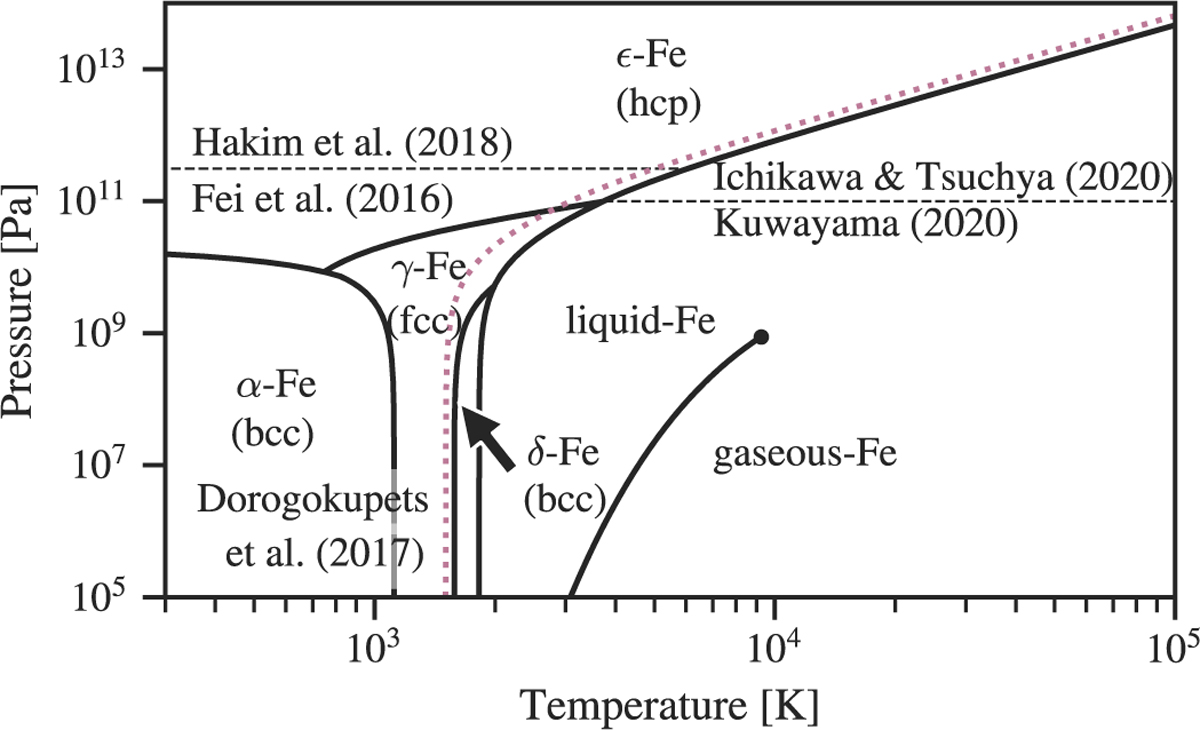
Phase diagram of pure Fe as it is used in the core model of BICEPS. The solid lines are the phase transition curves of Anzellini et al. (2013) and Dorogokupets et al. (2017). The dotted line illustrates the possible shift of the melting curve due to additional FeS in the core, using Eq. (11) to calculate the depression in the melting temperature.
Current usage metrics show cumulative count of Article Views (full-text article views including HTML views, PDF and ePub downloads, according to the available data) and Abstracts Views on Vision4Press platform.
Data correspond to usage on the plateform after 2015. The current usage metrics is available 48-96 hours after online publication and is updated daily on week days.
Initial download of the metrics may take a while.