Open Access
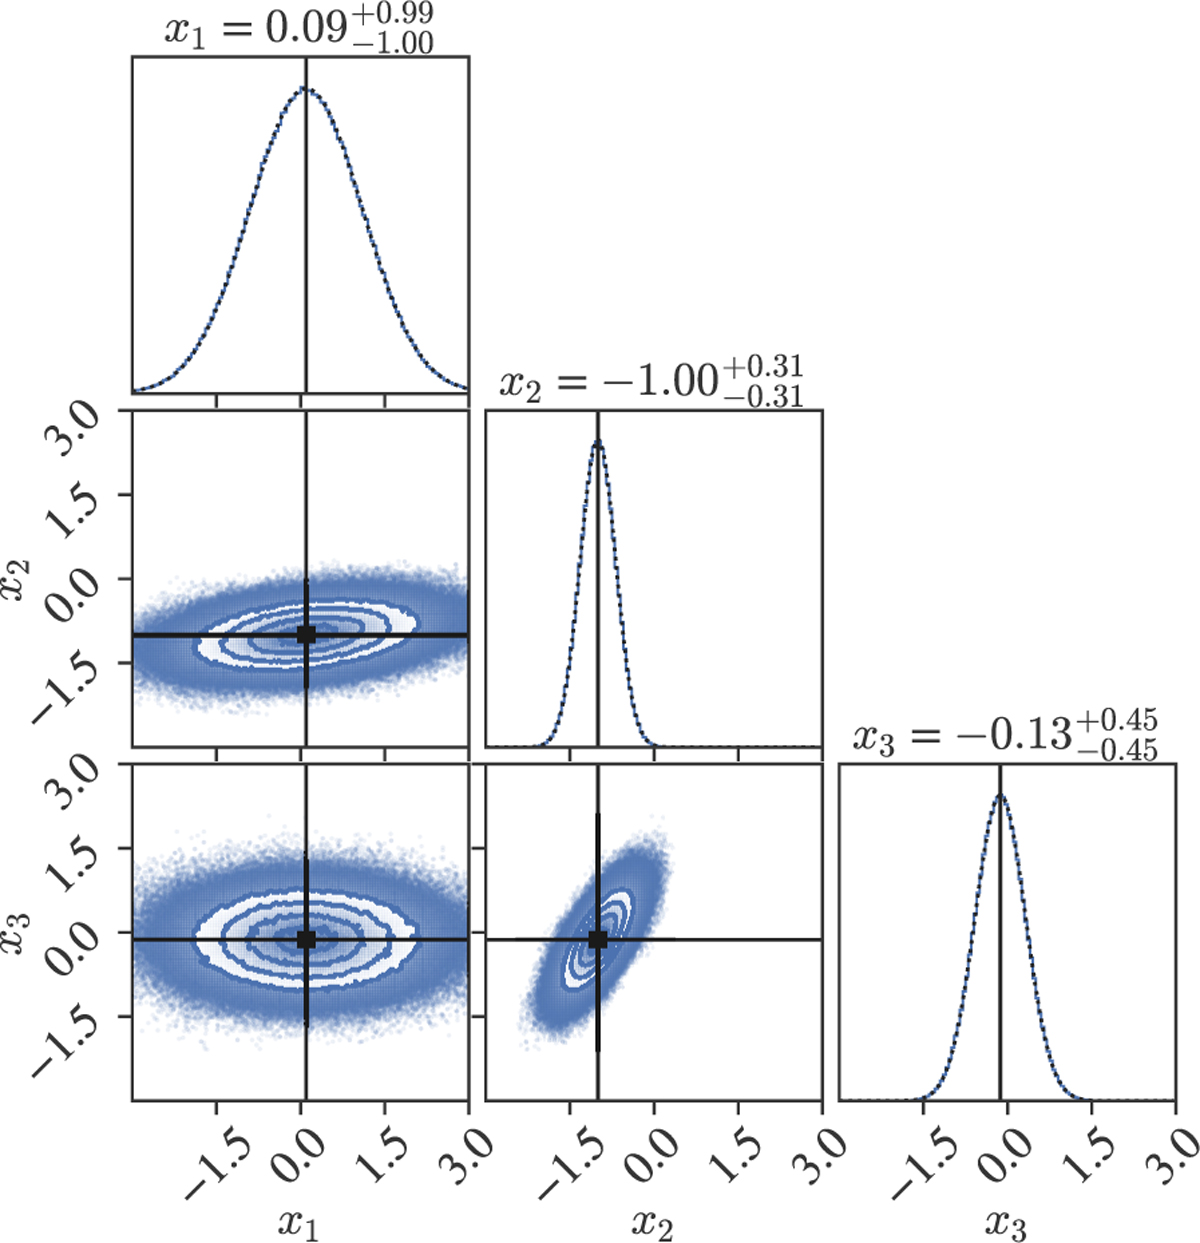
Fig. A.3
Download original image
Corner plot of the second MCMC validation test. The multivariate normal distribution with mean and covariance matrix given in Eq. (A.1), was sampled with 106 points. In black we show the analytical predictions, while in blue we show the results of the MCMC.
Current usage metrics show cumulative count of Article Views (full-text article views including HTML views, PDF and ePub downloads, according to the available data) and Abstracts Views on Vision4Press platform.
Data correspond to usage on the plateform after 2015. The current usage metrics is available 48-96 hours after online publication and is updated daily on week days.
Initial download of the metrics may take a while.