Fig. 3
Download original image
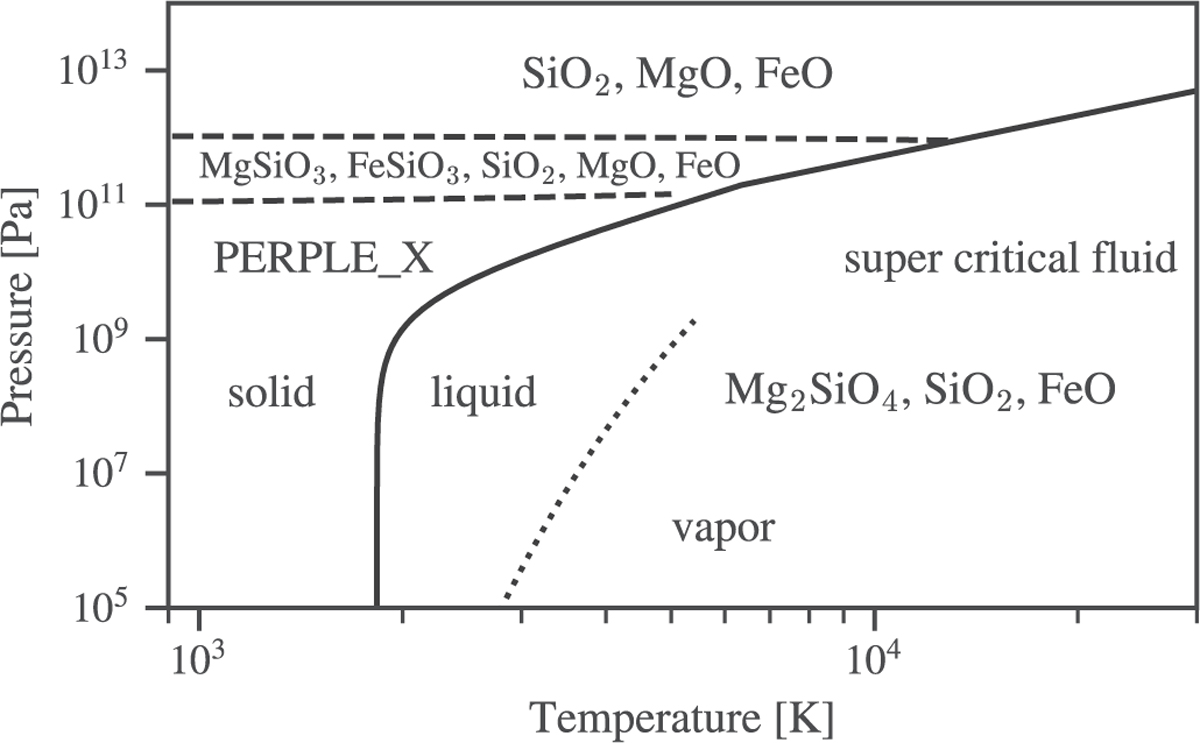
Schematic representation of the considered mantle model. Illustrating the wide range of thermal conditions covered by the used EoS. The fluid and the solid phases are separated by the MgSiO3 melting curve (solid line) of Eq. (16), including a correction factor for additional MgO, SiO2 and FeO. The two dashed lines represent the perovskite/post-perovskite transition (lower) and dissociation pressure (upper). The dotted line illustrates the approximate location of the vapor curve, calculated using M-ANEOS and the parameters for pure SiO2.
Current usage metrics show cumulative count of Article Views (full-text article views including HTML views, PDF and ePub downloads, according to the available data) and Abstracts Views on Vision4Press platform.
Data correspond to usage on the plateform after 2015. The current usage metrics is available 48-96 hours after online publication and is updated daily on week days.
Initial download of the metrics may take a while.