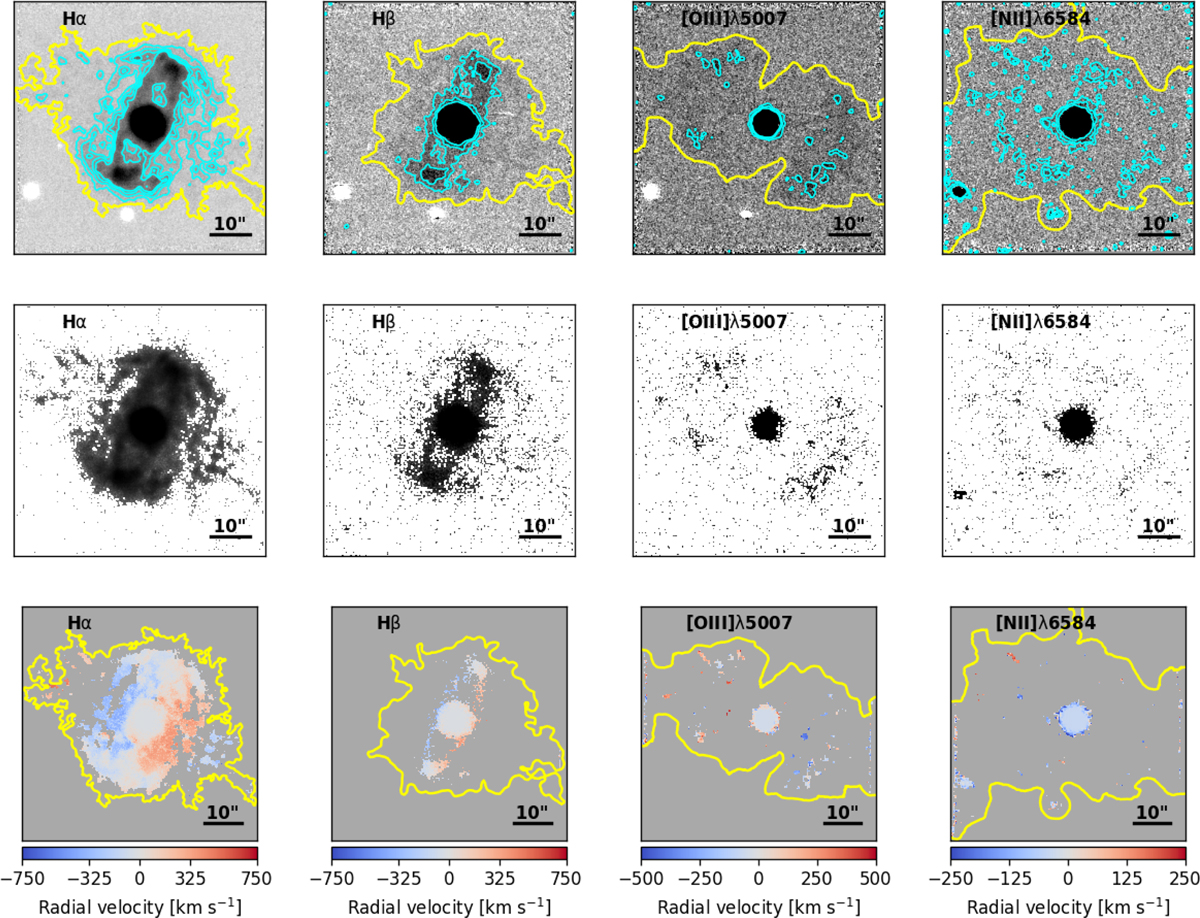
Fig. 1
Download original image
Narrow band images and velocity maps of the RR Pic nova shell obtained from the MUSE datacube. Top row: flux images of the shell in Hα, Hβ, [OIII] and [NII]. The yellow contour level indicates the median background value, while the cyan levels indicate fluxes up to 1, 2, 3 and 10 sigma over the background median for Hα, 1, 2, and 3 for Hβ and [OIII] and 0.5, 1, and 2 for [NII]. Middle row: same images as top row but presented in logarithmic scale to appreciate the extension of the faintest part of the nova shell. The contours presented in the top row have been removed for clarity. The bottom row shows the radial velocity maps corresponding to each line. in all images north is up and east to the left.
Current usage metrics show cumulative count of Article Views (full-text article views including HTML views, PDF and ePub downloads, according to the available data) and Abstracts Views on Vision4Press platform.
Data correspond to usage on the plateform after 2015. The current usage metrics is available 48-96 hours after online publication and is updated daily on week days.
Initial download of the metrics may take a while.